Chart of the Month – Active management is back but beware of the next equity sector rotation!
Active Management is back but beware of the next equity sector rotation!
Source: Goldman Sachs
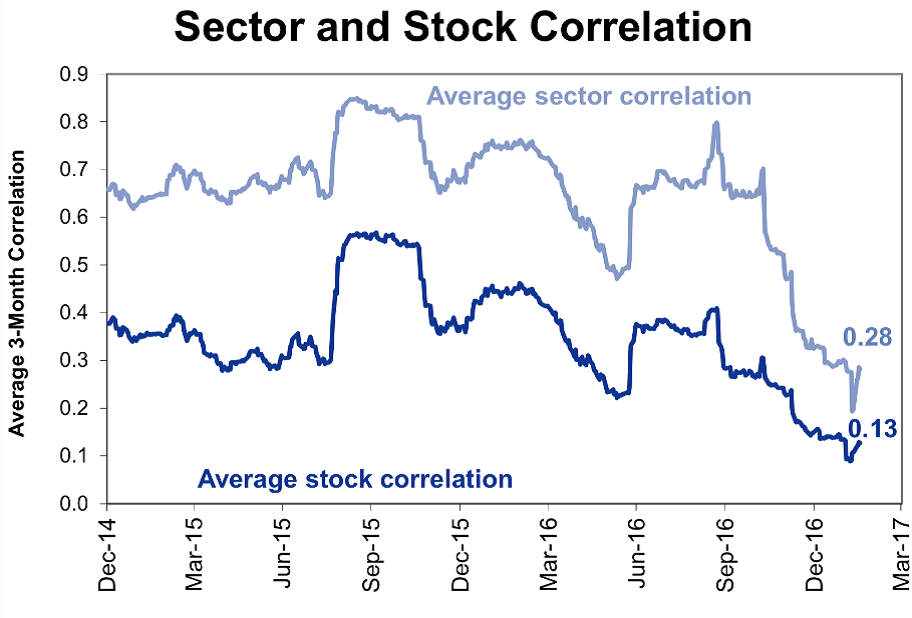
After a tough 2016, active managers (long-only stock pickers and hedge funds) are back in business and outperform their benchmark since November of last year.
This is due to two main reasons:
Number 1: Sector and stock correlation have come down to levels where active managers are able to generate positive performance and alpha. The global equity markets are now less driven by macro-economic factors (such as Oil, USD and China for instance) and central banks news. These markets seems more rational and driven by bottom-up stock specific news such as earnings and events.
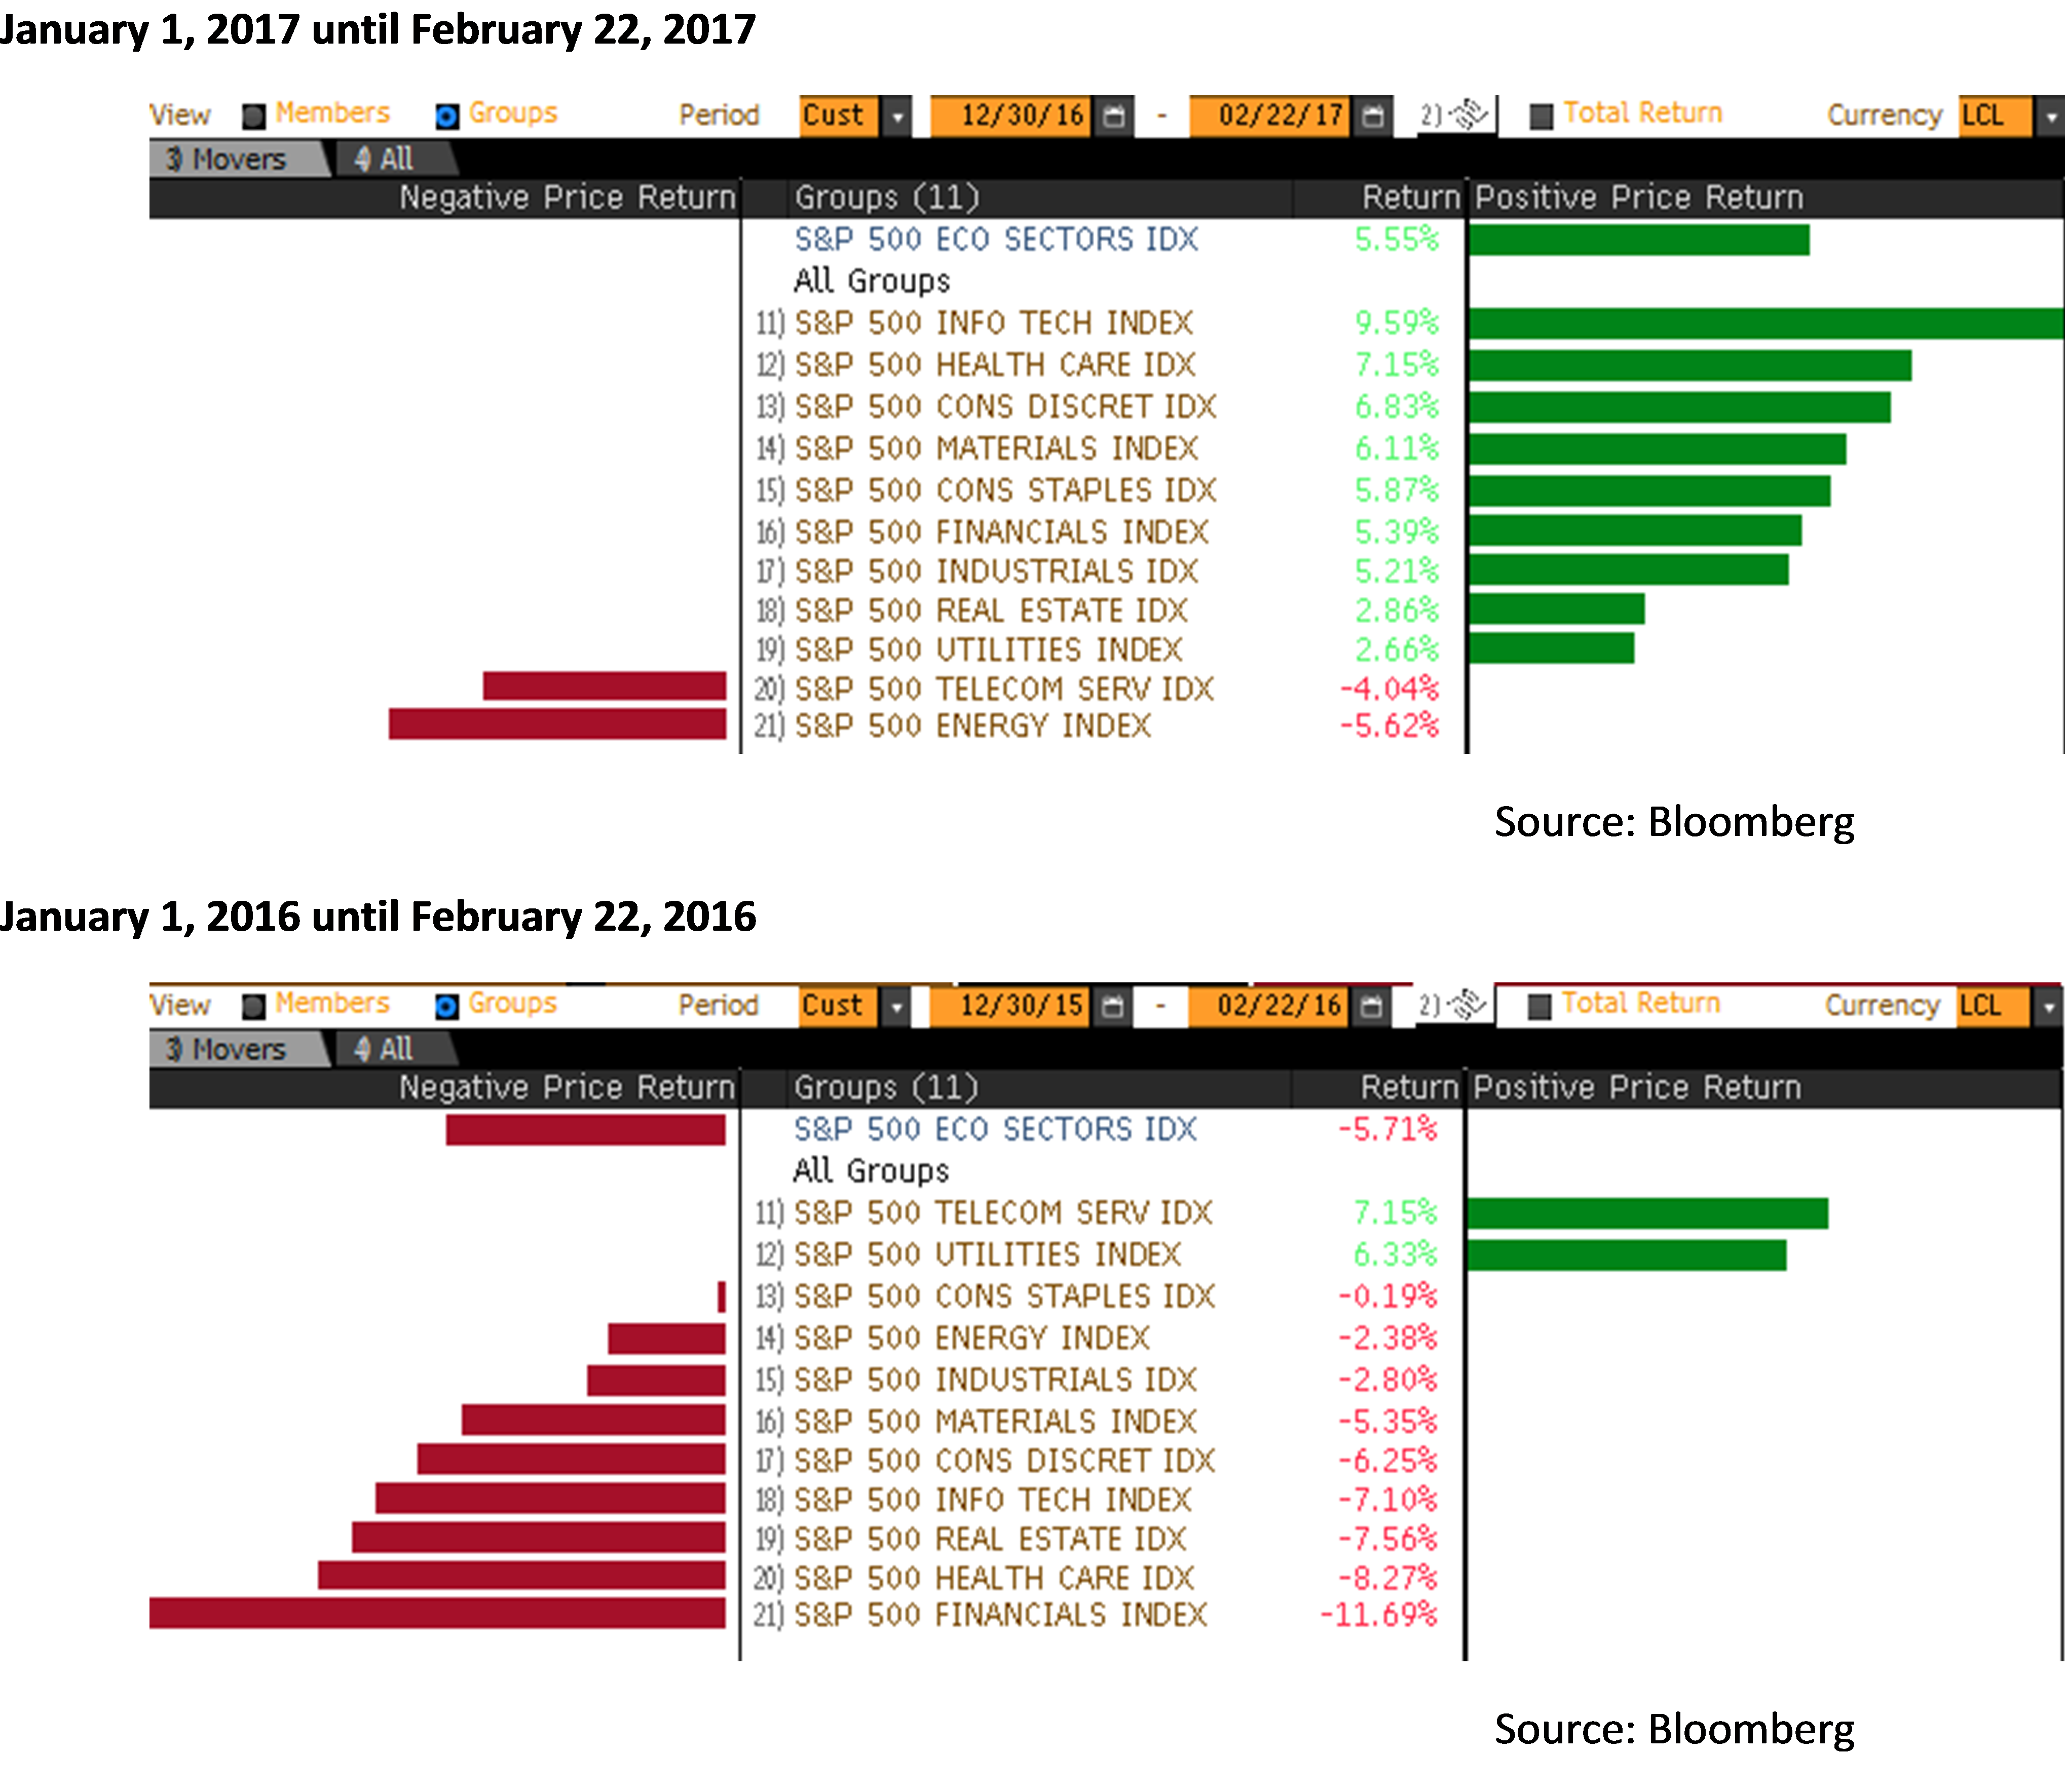
Number 2: The sectors which are driving performance this year (which is actually the mirror image of 2016 at the same time, see below) are IT, Healthcare and Consumer Discretionary. These sectors are currently favored by active managers and they tend to avoid (or go short if they can) sectors such as utilities and telecom. But beware of such outperformance in the short run, they tend not to last for too long. Wouldn’t it be wise to start taking some profit in these leading sectors?
Portfolio managers beware: factor based ETFs and how they can be helpful
Breaking down your broad universe of food groups into their more basic elements and nutrients is now part of our daily habits. Checking labels for sugar, fat, carbs and protein content isn’t just the remit of Californian health freaks but something that is part of every shopper’s habit nowadays. Although worlds apart from a chef preparing a meal in a restaurant, most asset managers will look at factors in exactly the same way we look at key ingredients: factors are to assets what nutrients are to food – both cream and pork bellies contain protein and fat, just as economic risk is present in public equities, private equity, high yield and hedge funds. Understanding portfolio drivers or risk and return through factor analysis isn’t much different from understanding how food groups react with each other under hot and cold conditions to produce the perfect meal. Following the path of the food industry, the disaggregation of investment returns which began with the CAPM in the 60s and advanced by the Fama-French three factor analysis in the 90’s has now moved from theory to the real world.
Many active managers have therefore used factor based models quite extensively with the building blocks of their factor analysis revolving mainly (for equity managers anyway) around value, small caps, low volatility, high yield, quality and momentum. A few years back when I worked for a large Swiss group, risk management would sit down with PMs and look at their portfolio based on the factors above as well as sensitivity to rates, oil and other more macro elements. If the PM claimed his or her main source of return was based on fundamental work and stock picking, the factor chart would have to reflect that, essentially showing very little exposure to any given one. If the factor study showed strong correlation to one or two factors, then performance (and risk) was driven by something outside their remit and we were confronted with a binary choice: either accept we’re paying fees for something that was a static bet (more often than not coming from the PMs style) or simply redeem. There was very little else we could do.
‘Today there’s a wide range of factors through smart beta ETFs that are available to investors which give a new range of options’ states Angel Sanz, Notz Stucki’s Chief Economist who analyses manager talent (or lack thereof) on a daily basis for the firm. ‘When a team comes by our office to see us, first thing I’ll do is look at regressing their performance on my Bloomberg terminal against several factors and try to understand what types of exposure they’re offering on a factorial basis. If they’re unaware of how their return stream looks through a factor model or can’t address the differences between their portfolio’s characteristics and those of the closest factor index, it will make for a very short meeting. In the past, I may still have invested’ opines Sanz ‘if I felt this type of factor exposure made sense (i.e. I was underexposed to this factor) even though I felt fees were egregious for something that didn’t require much talent. Today though, why would we want to pay fees to an active manager when ETFs are readily available that can give me the same kind of exposure?’
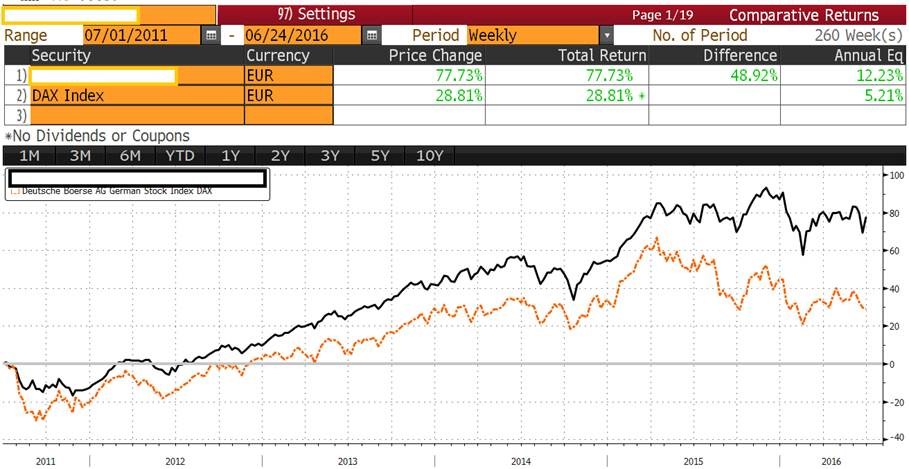
Graph 1 performance of actively managed German equities Fund vs its index
Graph 1 above looks compelling right? At first glance, this manager investing in German equities (black line) looks like they’re adding quite a bit of value (or alpha) vs the DAX (yellow line).
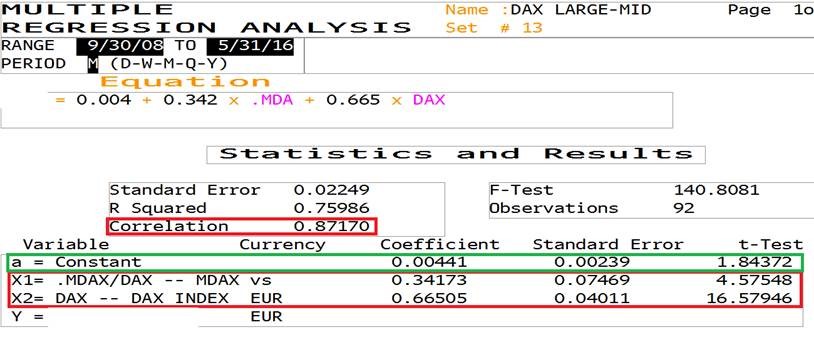
Table 2 linear regression of the fund vs German equity risk premia
But a closer look at a regression analysis on Bloomberg, trying to explain his or her returns shows a different picture. In table 2, it becomes clear that almost 100% of the performance can be explained by 2 factors, the DAX and the MDAX (the German mid cap index). The constant or alpha is low and not even statistically significant (i.e. t-test below 2)… a different proposition altogether.
To get back to basics, an active manager’s return in excess of the benchmark can be broken down into three components (1) returns to static factor premia, such as tilt to value or momentum stocks (2) manager skill coming from factor timing and (3) manager skill coming from security selection. Points 2 and 3 are the only things we’re willing to pay for and now we can do something about it.
It can also help assessing what kind of risks we have in our overall portfolio. Factor based studies also help us better understand, on a look through basis, what kind of risks we’re taking for our overall portfolio. Norges, the (very) large Norwegian wealth fund and government pension plan, were instrumental in addressing this. In late ’08, they were surprised at how their investments, which had supposed independent bets and offered adequate levels of diversification, all collapsed in tandem. It was their drive in trying to understand what they had exposed themselves to that led to this development, ultimately pushing most institutions to look at factors in a more granular way.
‘I’m looking to pay active managers who generate genuine alpha through either tactical timing around markets and factors or through security selection. Static factor tilts can be replicated more cost efficiently with smart beta strategies’ opines Sanz and goes on to conclude ‘the availability of smart beta ETFs helps me improve portfolio outcomes, reduce costs and more importantly increase performance transparency’.
A (deep) contrarian view: Buy the basket of top holdings in US Hedge Funds
BUY THE BASKET OF TOP HOLDINGS IN US HEDGE FUNDS
CURRENT SITUATION
Source: Bloomberg
2016 has been a very tough year for active managers, especially in the equity US market (both hedge funds and long only funds). From 31-Dec-15 to 30-April-16, the SP500 NTR has gained 1.73% whereas the Tremont Long-Short Index has dropped 4.52%. Several reasons may explain this:
• Metals and oil prices “unexpectedly” rebounded very quickly and the basic resources companies outperformed dramatically the market. Hedge fund managers were underexposed or short these sectors.
• World economic growth data disappointed again, long-term rates dropped and as a consequence the low volatility interest rate sensitive sectors (consumer staples, utilities, telco services) also outperformed. Hedge fund managers were underexposed or short these sectors.
• Momentum factor has not performed this year, and hedge funds are typically momentum oriented.
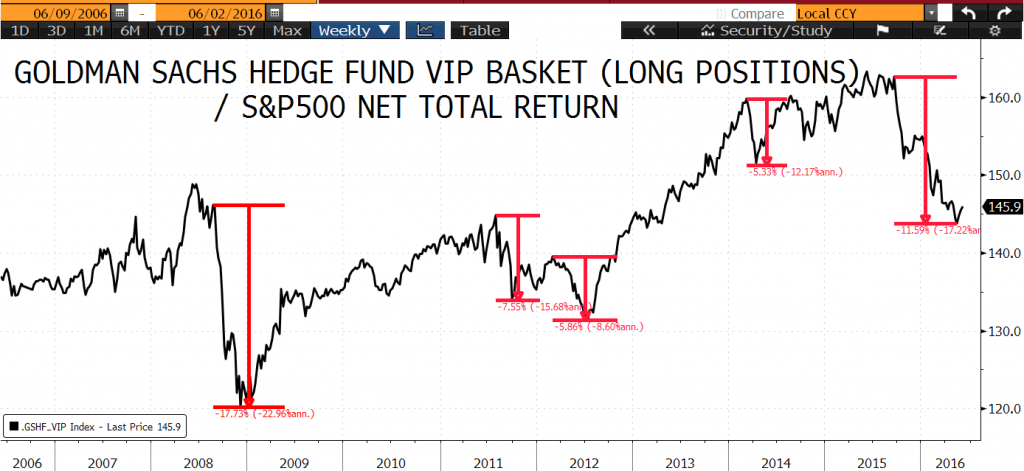
On a quarterly basis, Goldman Sachs update a list with the 50 stocks that most frequently appear among the largest 10 holdings of hedge funds. This list is called GSTHHVIP, from now on, the BASKET. In the graph above you can see the relative performance of the BASKET versus the S&P500 Net Total Return. This has been the second worst period for the BASKET (relative to the index) for the last 10 years with a relative underperformance of 11.5% during the last 11 months.
EXPECTATIONS
The “unexpected” sector rotation that took place during the first 5 months of the year has started to revert and fundamentals are becoming (again) more important than technical factors.
Typical low growth or very cyclical companies are starting to underperform whereas more stable or growth companies like information technology or health care have started to outperform.
Correlation between stocks and correlation between sectors have decreased to lower levels, typical symptoms of a “more rational” market.
Hedge funds, though expensive sometimes, are still the most talented people in the industry and after periods of underperformance they tend to recover (See chart).
From the sector point of view the basket is overweighting Consumer Discretionary and Health Care companies which is in line with our market view.
From the technical point of view, the MACD signal (indicates changes in a security’s underlying price trend, so you can identify turning points) is giving a very strong indication to buy the BASKET index relative to the SP500
RECOMMENDATION
Buy the BASKET and short the SP500. This trade has a historical volatility of about 6%, so it can be implemented with 2 times leverage. Historically, the beta of this basket has been 0.13.
Time horizon for this trade: In the past, it took between 3 months to 9 months to grasp the profits of this trade.
Why do not make a trade long the HF top holdings and short the HF less owned stocks? Because the least owned stocks have outperformed the market in the past (surprise, surprise!)
Why do not make a trade similar to this with the overweight positions of the mutual fund industry? Because the data is only 4 years old and the relative performance has historically be less important.