Chart of the Month – Building the perfect mousetrap for capturing alpha

Chart of the Summer – Building the perfect mousetrap for capturing alpha


Hedge fund performance overall has been disappointing this year with the HFRX Global Hedge Fund Index barely turning positive YTD as of the end of June. With your typical Balanced 60/40 portfolio up just under 10% YTD (BUT still underwater over the last 2 years!) and cash rates above 5%, hedge funds are facing a big challenge this year as the bogey has changed in the last 9 months. This year has clearly been a year for more directional equity long short managers and less so for market neutral given how narrowly led the market has been (and not only in the US with its Magnificent Seven). In addition to the lack of breadth in the market, the bi-polar factor rotation and sector re-positioning (chronic over the last few years) has caught many managers off guard (blame it on the quant funds – mostly stat arb).

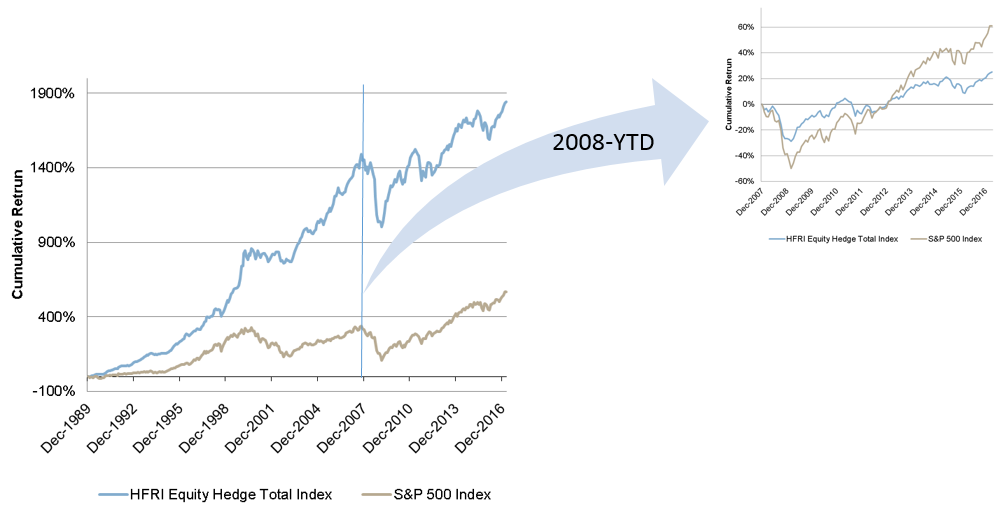
Building a longstanding legacy that is built to last with a clear succession plan to compound returns with consistency over time is more challenging for investment managers that become victims of their success than it is for consumer brands, with the inevitable style drift that comes with a successful track record, as they take in more assets than they can manage, which is the ultimate nail on the coffin. The alternative: the multi-PM model which offers decentralized portfolio management with no single risk-taker able to rock the boat, combined with centralized risk management and the ability to scale in size (to a certain point) where investment opportunities arise. This model has been around since the end of the 1980s and has proved itself over time in compounding consistent returns beyond traditional benchmark indices. This month’s chart compares the Barclays Multimanager Index of 42 multi-PM platforms versus the HFRX Global Hedge Fund Index and highlights why this model has been so successful with investors (mostly pension funds, sovereign wealth funds and private banks). It should be of no surprise that most of the growth in the $4 Trio. hedge fund industry over the last few years has been in the multi-PM space given their ability in providing consistent risk-adjusted performance and more importantly their capacity to protect capital during market drawdowns in comparison to multi-strategy funds led by a single PM that sooner or later stumble and fall before re-jigging their strategy. Their capability in identifying talent and allocating capital efficiently across various strategies has proved itself to a point where the competition for talent has reached extremes and has become a game of musical chairs. Poaching traders between multi-PM platforms has now become like paying for star football players (which does not necessarily guarantee the success of a team, but who cares, if they can score big on their own).  The success of the multi-PM platform model can be further illustrated by the number of PMs that have left some of the oldest and most successful platforms over the last 25 years following a so-called stellar track record but then fail to deliver when they launch on their own. There are countless examples of these which attest to the robustness in the construct of the multi-PM platform.

The significant rise in the risk-free rate of late has somewhat challenged a platform’s ability to generate a high Sharpe ratio in addition to the subpar performance as traditional sub-strategy buckets are not working as well YTD. The most common allocations by sub-strategy within a multi-PM structure and the reason for their underperformance YTD are: Fundamental Equity Long Short (market neutral strategies are going through one of the worst years due to massive short squeezes), Discretionary Macro (tough year to call the direction of rates unless you focus on EM), Merger Arbitrage (less deals as money is no longer cheap and the regulator has taken a tougher stance), Capital Markets (the IPO/SPAC market has dried up and not many new deals) and Systematic Macro (tough year to catch trends and have completely missed the equity market rally). What has worked this year has been Global Credit, Fixed Income RV, Convertibles and unsurprisingly Commodities (where most multi-PM platforms are less exposed). Quant strategies have had mixed results but are an inherent part of the build as a diversifier of alpha sources but often plagued by “love / hate” relationships until they get thrown out and replaced down the line with a new team if they underperform over time. They are, however, better able to perform during periods of market volatility given their shorter-term time horizon.

One could say that there are way too many hedge funds today (more than the 16,041 Starbucks stores in the US alone!) fishing in the same pond for the most part i.e. the US equity market where the number of listed companies has drastically fallen from over 8,000 companies (at its peak in 1996) down to 3,700 today (thanks to private equity groups or bankruptcies). You have the same number of stocks listed in Japan today so go figure why there are barely any hedge funds left trading out of Tokyo (the capital of equity market neutral strategies)! Finding 50 of the best capacity constrained sector PMs is easy but getting 250 is more difficult with the inherent risk of diworsification. The big question today is whether the multitude of multi-PM platforms are arbitraging themselves out. The fact that they have increasing amounts of capital under management, which must be deployed across the same popular sectors and in liquid stocks, have all ended up trading the same equity names. In addition, the average holding period of a stock in the US is down to 10 months down from 5 years back in the 70s. Not surprising that we occasionally see a platform winding down a sector or sub-strategy pod which has breached its risk limits and has had to liquidate, creating a ripple effect across other multi-PM platforms which in turn are forced by their risk control teams to cut risk. The inherent leverage used within these platforms (which varies widely amongst them) to enable them to increase alpha only amplifies the ripple effect.

The big dilemma for platforms today is whether to onboard managers to have exclusivity (which comes at a price and with no performance guarantee) or work with outside independent managers and/or the sell-side. External Alpha-capture programs were first pioneered by Marshall Wace back in 2001 (initially started as a summer internship project) to enable buy-side firms to track and analyze the sell-side’s best ideas. At the time the average lifespan of a contributor was and still is around 4-5 years. Compared to the average lifespan of a PM within one of the oldest multi-pm structures today, it is now down to 17 months (Darwinism!). Perhaps the platforms concentrated down to 20-30 PMs (like the traditional fund of funds model) will do better but their capacity will be constrained. We will always be reminded that size is your biggest enemy. With at least ten new platforms slated to launch this year, the trend is far from over.

Ultimately, it is more of an art than a science and as one manager told me back in the 90s “we all use the same ingredients but it’s the recipe that makes the difference…”


Past performance is not indicative of future results. The views, strategies and financial instruments described in this document may not be suitable for all investors. Opinions expressed are current opinions as of date(s) appearing in this material only. References to market or composite indices, benchmarks or other measures of relative market performance over a specified period of time are provided for your information only. NS Partners provides no warranty and makes no representation of any kind whatsoever regarding the accuracy and completeness of any data, including financial market data, quotes, research notes or other financial instrument referred to in this document. This document does not constitute an offer or solicitation to any person in any jurisdiction in which such offer or solicitation is not authorized or to any person to whom it would be unlawful to make such offer or solicitation. Any reference in this document to specific securities and issuers are for illustrative purposes only, and should not be interpreted as recommendations to purchase or sell those securities. References in this document to investment funds that have not been registered with the FINMA cannot be distributed in or from Switzerland except to certain categories of eligible investors. Some of the entities of the NS Partners Group or its clients may hold a position in the financial instruments of any issuer discussed herein, or act as advisor to any such issuer.  Additional information is available on request.
© NS Partners Group
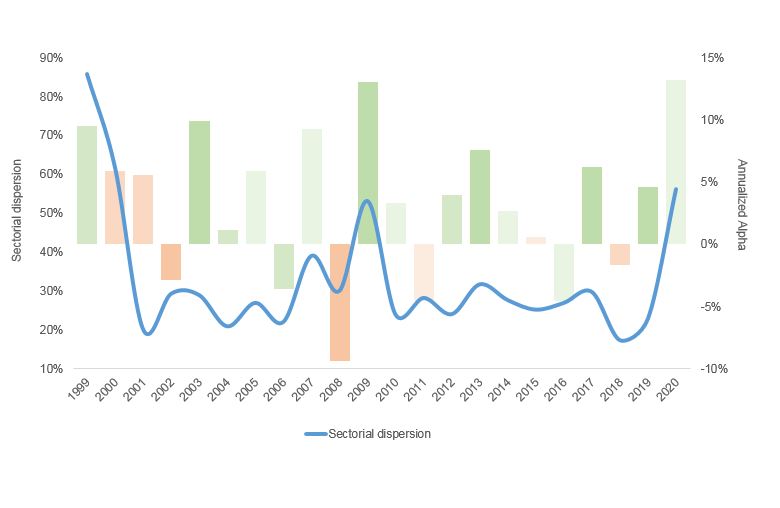
Chart of the Month – High market dispersion creates alpha opportunities!

High market dispersion creates alpha opportunities!

Long / Short Equity Alpha and Market Sectorial Dispersion; Source: Notz Stucki


Due to the Covid-19 pandemic outbreak, 2020 is un-comparable to any other year in financial markets. Authorities in major countries in the World have taken drastic measures to save lives, which have a large negative impact on economic activity. As a response, central banks and Governments have reactivated quantitative easing and started fiscal stimulus in a big way. After having corrected by the same amplitude as in 2008 but in a space of 3-weeks, financial markets literally experienced a V-shape trajectory and are now just back in positive territory if we consider equities and the MSCI World Index. Active managers, and particularly equity long/short managers, have been able to deliver alpha, posting double-digit positive returns.

But let’s take a longer timeframe. If we consider the last 20 years, it is interesting to see the alpha generated by the Haussmann Fund versus the equity market every year and compare it to the MSCI World’s sector dispersion measured by the difference between the performance of the 2 best sectors and the 2 worst sectors. The right axis represents the alpha and if the color of the bars are green it means that market shows a positive return and when it is orange the market shows a negative return. The darker the green bars the more positive the market and vice versa.

The first conclusion is that equity long/short managers are able to generate positive alpha both in down and up markets. The second conclusion, which is more important in a way, is that there is a clear correlation between alpha and sectorial dispersion. This is particularly true when dispersion (with the measure explained above) is above 30% like in 1999 & 2000, 2009 and 2020! We believe that the market environment with high sectorial dispersion, low correlations between stocks within a sector, discrimination between winners and losers and sustained volatility, which gives good entry and exit points, remains favorable for active management in the coming quarters.


Past performance is not indicative of future results. The views, strategies and financial instruments described in this document may not be suitable for all investors. Opinions expressed are current opinions as of date(s) appearing in this material only.

References to market or composite indices, benchmarks or other measures of relative market performance over a specified period of time are provided for your information only. Notz, Stucki provides no warranty and makes no representation of any kind whatsoever regarding the accuracy and completeness of any data, including financial market data, quotes, research notes or other financial instrument referred to in this document.

This document does not constitute an offer or solicitation to any person in any jurisdiction in which such offer or solicitation is not authorized or to any person to whom it would be unlawful to make such offer or solicitation. Any reference in this document to specific securities and issuers are for illustrative purposes only, and should not be interpreted as recommendations to purchase or sell those securities. References in this document to investment funds that have not been registered with the FINMA cannot be distributed in or from Switzerland except to certain categories of eligible investors. Some of the entities of the Notz Stucki Group or its clients may hold a position in the financial instruments of any issuer discussed herein, or act as advisor to any such issuer.

 Additional information is available on request.

© Notz Stucki Group

Chart of the Month – Trading on a Tweet

Trading on a Tweet

Source: Warren Financial

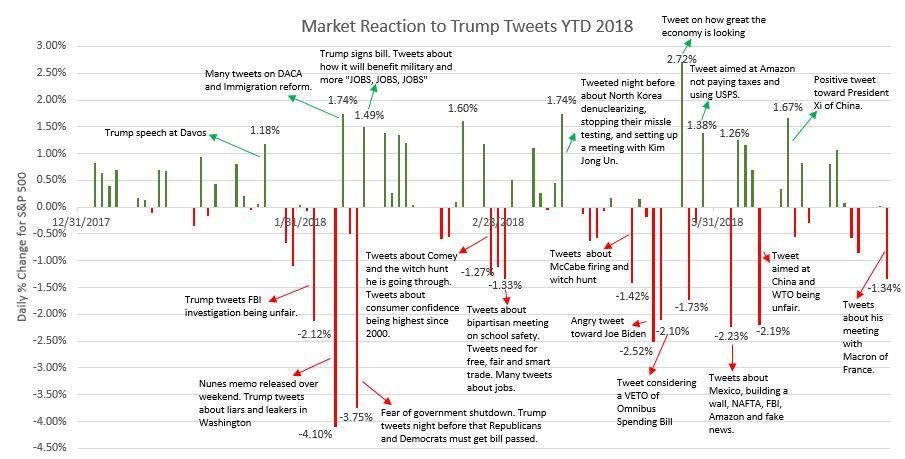
When one looks at the statistics, the people with the most followers on Twitter are typically rock stars like Katy Perry, Justin Bieber, Rihanna or sport stars like Cristiano Ronaldo, Neymar, LeBron but surprisingly in position No. 3 is Barack Obama. In No. 18 we have Donald Trump who beats the top 30 (including Justin Bieber) by a very wide margin in terms of the number of Tweets sent out to date. Since joining Twitter in 2009, it is said that one in every eight posts from Trump is a personal insult of some kind. However, there is no doubt that he has used Twitter to his advantage during the 2016 election campaign and more importantly after being elected has been able to notably influence market moves via Twitter.

The above chart illustrates the power of an overnight Trump tweet in influencing markets and/or individual stocks. Referred to as Wall Street’s cheerleader in chief by CNBC, Trump has the power to make or break a company’s share price, at least temporarily, creating short term trading opportunities. It should be no surprise that many money managers (both discretionary macro and equity long / short) have become hooked on Trump’s Twitter feed as it has become an interesting source of trade opportunities. One of our macro managers recently mentioned in his letter to investors the term Twitternomics, or Policy Making by Twitter, which has cut the middleman in US policy-making and added greater transparency and accountability.

Who would have thought of creating a short term trading signal to trade the US market based on overnight Tweets from Trump. Even the most famous day trader of Wall Street (William O’Neill of Investor’s Business Daily) would never have dreamt this could be possible.

For those looking for a new source of Alpha, follow the Tweet…


Chart of the Month – Small caps versus large caps: small is beautiful… Especially in Europe!

Small caps versus large caps: small is beautiful… Especially in Europe!

Source: Notz Stucki

It is often said that Small Caps outperform Large Caps over the long term; it is true, and makes sense. Smaller companies are more agile, tend to fall less under the burden of regulation, and are generally more “pure plays” on their businesses. On top of that, small caps are natural targets for larger groups, which frequently accept to pay a generous premium for acquiring knowledge, market share or capacity.

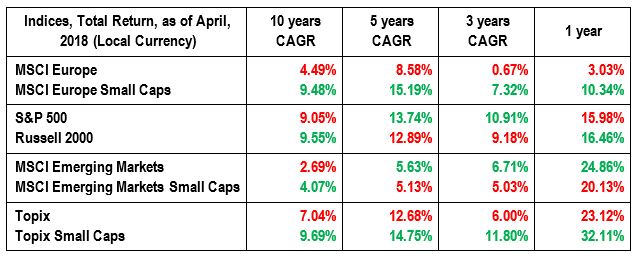
Despite that, as can be seen on the table above, Small Cap indices don’t systematically outperform Large Cap benchmarks on all time frames in all regions. We see that US Large Caps or Emerging Market Large Caps sometimes do better, but the differences between both is usually tiny. To wit, the SP 500 only lags the Russell 2000 by 50 basis points CAGR on a 10 year time frame.

But two regions clearly differ: Europe and Japan, where for all periods Large Caps lag Small Caps by a wide margin: the difference reaches almost 500 bps annually on a 10 year period (265 bps for Japan)! Such extremes call for a thorough explanation; when digging a little bit deeper into the indices, the underperformance of European (and to a lesser extent Japanese) Large Caps essentially derives from the index constituents. When it comes to Europe, Financial stocks make up more than 20% of the Large Caps benchmark, Telecoms and Utilities more than 6.5% combined and Information Technology only 5%, a very significant difference compared with Small Caps. Due to the dismal performance from Banks, Telecoms and Utilities during the last decade, we have the explanation. In Japan, the performance spread between Large Caps and Small Caps stems more from the heavy representation of car manufacturers (also poor performers these last years) in the main benchmark. And in the US the heavy weightings of Technology behemoths in the S&P explains the narrowness between Large and Small Caps’ performances.

Should we expect European Large Caps indices to catch up with Small Caps? We frankly doubt it as national champions in Banks and Utilities will remain highly represented and due to their utmost importance for Governments, there is a clear trend for these businesses to face tougher and tougher regulations, which does not bode well for future equity performances. They can be exciting short term trading ideas but can hardly be considered as attractive long term investments.

Consequently, we are still extremely favorable to the Small Caps space in Europe, especially that there are numerous talented boutique managers doing a brilliant job on the asset class, who generate high level alpha over the years. So by cherry picking them we get the best of both worlds: a very good asset class managed by very good investment professionals…. Beautiful, indeed!


Chart of the Month – Alpha generation is back!

Alpha generation is back!


Source: Notz Stucki

Equity markets have entered into a new volatility regime since February 2018. This could have been expected with the beginning of the end of QE decided by all major central banks since almost 10 years following the global financial crisis.

During this period of massive liquidity injections in markets, equities have performed well, especially in the US, particularly in the healthcare and technology sectors. The European economic recovery has been slower to materialize than in the US and the MSCI Europe Index was up +28.5% over the last 5 years.

Active managers like fundamental stock pickers or equity long/short managers have struggled to deliver alpha in a context of risk on/risk off mode driven by macro factors. The scenario has started to change over the last 12 to 18 months as can be shown on the cumulative alpha generated the managers selected in Lynx compared to European equities. Since February 2017, Lynx has generated more than 10% of alpha compared to the MSCI Europe Index.

With a lower correlation between stocks and sectors and a slow normalization of interest rates, we think that active managers should continue to deliver alpha and should be the approach to favor when investing in equities.


Chart of the Month – In Re-Search of Alpha

In Re-Search of Alpha


Source: Bloomberg, Notz Stucki

Alexander Ineichen of UBS Warburg was well known in the hedge fund world for his first publication in 2000 of a series of four to follow titled “In Search of Alpha – Investing in Hedge Funds”. This was a guide written to de-mystify hedge fund investing following the hedge fund industry’s two decades (the 1980s and 90s) of spectacular returns. Coincidentally, this publication was released just after Reg FD (Regulation Fair Disclosure) was introduced in August 2000 putting an end to inside information. At the time hedge fund assets totaled $491 bn. (having increased more than twelvefold from a decade earlier). Although hedge funds survived the dot-com bubble bust in 2002, hedge fund returns overall became more muted before collapsing in 2008 due to the global financial crisis (GFC) and marking the beginning of what may be considered the “lost decade” for hedge fund investing with sub-par returns. With total hedge fund industry assets totaling more than $3 tn. Today (despite over 8,000 funds having shut down since the GFC), generating Alpha has become very challenging in an environment of zero/negative interest rate policies across the globe that has followed various quantitative easing initiatives in China, the US, Japan and Europe. Chasing market Beta has been the layup trade of the decade and unfortunately many hedge fund managers (both in the Equity Long Short and Discretionary Macro space) have missed out on or been penalized by their short exposure. Any announcement of quantitative easing has turned out to be a catalyst for a significant market rally (in China, the US, Japan and Europe) and one would have been better off being leveraged long chasing market Beta to generate outstanding returns. Another set of successful layup trades would have been to be long the local equity market following the destitution/election of a new president/prime minister. This was the case in Japan, Brazil, Argentina, India and more recently in the US sparking double to triple digit market rallies (in percentage terms).

Hope can go a long way in sustaining equity markets (despite mediocre fundamentals) making it very difficult for hedge funds to generate alpha. So no wonder low cost ETFs (index tracking funds) have been attracting $131 bn. just in the first two months of the year taking total assets in this space to over $3.6 tn. There is not a week that goes by without the press criticizing the underperforming active management industry that charges high fees versus low cost ETFs. Yet there is a breed within the hedge fund industry that has been generating impressive returns on a consistent basis. Call them computer nerds for lack of a better definition, quant high-frequency trading funds essentially based on short term stock price moves (as opposed to changes in underlying fundamentals of a company) have been slowly chipping away at generating Alpha and amassing the most significant amount of hedge fund assets in recent years. Perhaps the proliferation of ETFs has worked in their favor but one thing is certain, market moves have increasingly become shorter term in nature. With high frequency trading accounting for up to 50% or more of trading volumes in the US and possibly in Europe, generating alpha has become ever more challenging. At some point markets will no longer continue to trade on hope alone and the third greatest US bull market in modern history will come to an abrupt end. There are still a number of hedge funds that are well worth investing in despite the criticism by the press so would you rather not be hedged in equities when the tide turns? With ETFs and risk-parity products having amassed billions of dollars chasing performance, a rapid reversal in markets could snowball into massive selling within a short space of time and could prove to be not as liquid as intended (on August 24th, 2015 more than 1/5th of US-listed ETFs were forced to stop trading as the Dow lost 1,000 points in early trading). Buyer beware!


Chart of the Month – Active management is back but beware of the next equity sector rotation!

Active Management is back but beware of the next equity sector rotation!

Source: Goldman Sachs

After a tough 2016, active managers (long-only stock pickers and hedge funds) are back in business and outperform their benchmark since November of last year.

This is due to two main reasons:

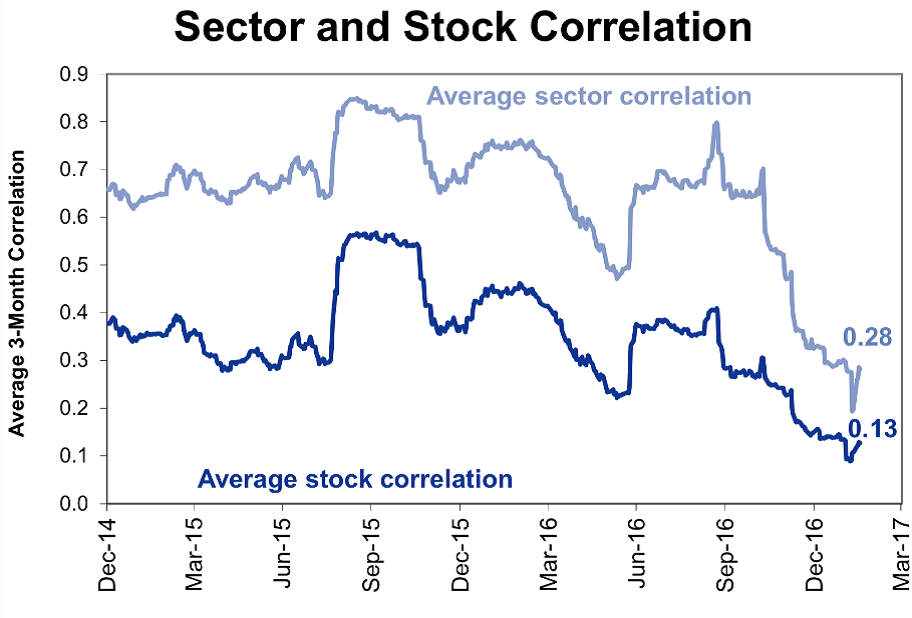
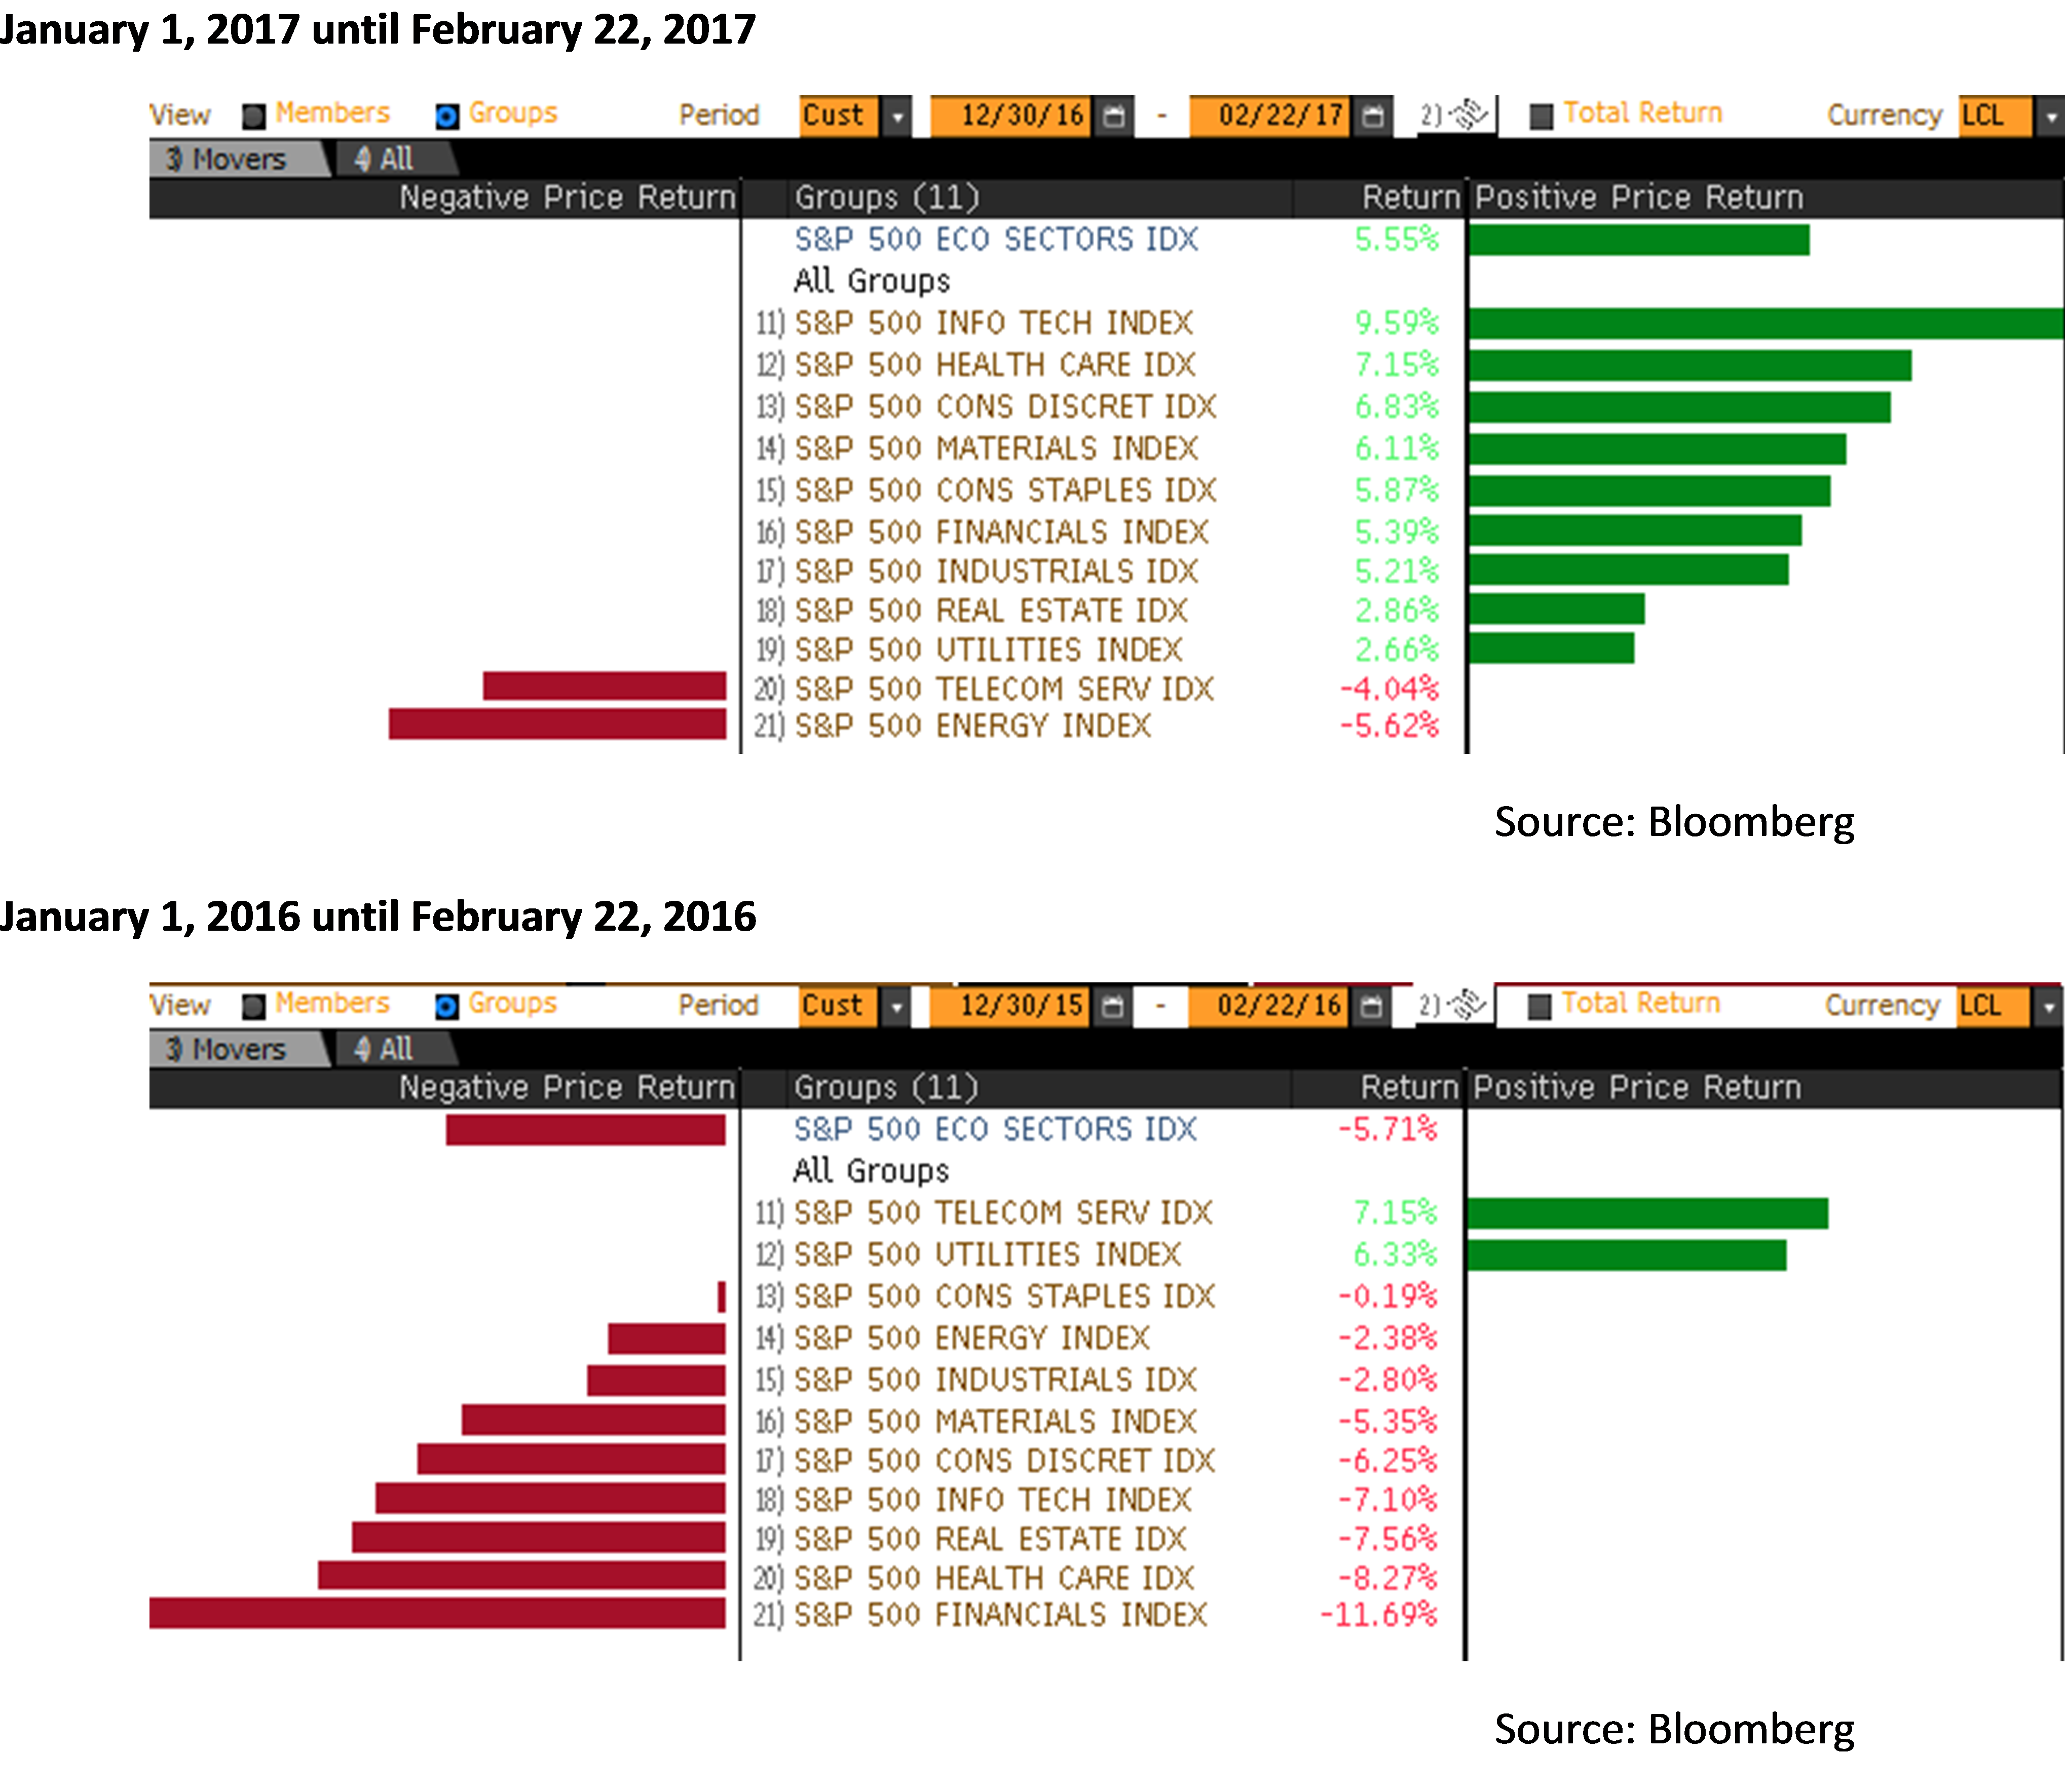
Number 1: Sector and stock correlation have come down to levels where active managers are able to generate positive performance and alpha. The global equity markets are now less driven by macro-economic factors (such as Oil, USD and China for instance) and central banks news. These markets seems more rational and driven by bottom-up stock specific news such as earnings and events.

Number 2: The sectors which are driving performance this year (which is actually the mirror image of 2016 at the same time, see below) are IT, Healthcare and Consumer Discretionary. These sectors are currently favored by active managers and they tend to avoid (or go short if they can) sectors such as utilities and telecom. But beware of such outperformance in the short run, they tend not to last for too long. Wouldn’t it be wise to start taking some profit in these leading sectors?

March 2017 2