Last one standing – Reconsider European equity long short funds – NS Insights

European equity long short funds have suffered from Europe’s lack of appeal. But now might be the time to reconsider them.

At the beginning of the 2000s, most private banks and asset management firms based in Geneva managed their own funds of funds that invested in a new generation of young alternative managers specialising in European equity long/short strategies. At the time, these multi-manager funds delivered double-digit annualised returns, net of management and performance fees. After starting their careers as equity managers within large traditional investment companies, most of these talents left in the 1990s to establish their own independent asset management firms. Many of them were backed by alternative investment legends such as George Soros and Michael Steinhardt, to run portfolios of long/short equity ideas in Europe, a strategy that had already proven its worth in the United States since the 1950s.

An endangered species?

Today, all European funds of funds specialising in long/short equity have disappeared, with one exception. The main reason: the 2008 global financial crisis wiped out many hedge funds in Europe, partly because they offered more attractive liquidity terms than their American counterparts. Added to this, the US equity market has significantly outperformed Europe since 2009 (thanks to the tech sector), following a similar trend from 1989 to 2009, which further reduced the appeal of European equities. Moreover, Europe has been weakened by geopolitical challenges, making it even less attractive to international investors.

Investors have short memories

Yet it is well known that every crisis also presents significant opportunities for long/short managers. Many have already forgotten the Greek debt crisis at the end of 2009 and, more importantly, the country’s remarkable recovery after the 2018 bailout! This year, Greece ranks among the best-performing equity markets in the world, alongside other so-called peripheral markets like Poland, the Czech Republic, Spain and Italy, while Switzerland has lagged, moving similarly to France since the start of the year.

Make Europe Great Again

Published at the end of 2024, the Draghi report provided European leaders with a roadmap to “make Europe great again” by boosting investment and productivity. The report highlighted the need to invest EUR900 billion annually (around 4.5% of EU GDP) to address the continent’s structural competitiveness gap. This year, Germany announced a EUR500 billion plan over ten years to modernize its infrastructure. More recently, Blackstone unveiled plans to invest USD500 billion in Europe over the next decade. And this is just the tip of the iceberg, with many other initiatives underway across the continent to strengthen its competitiveness.

Europe is home to some of the world’s best companies

While Europe certainly has its share of struggling companies, it is also home to some of the most successful firms globally in luxury, pharmaceuticals, chemicals, energy, defense, and aerospace, all ideal playing fields for long/short strategies. Despite this, the universe of European long/short managers has been shrinking every year since the 2008 financial crisis, due to a lack of interest or liquidity compared to the US. Nevertheless, on a regional basis, managers focused on Europe have been among the top performers since the start of the year.

High potential but hard to access

History shows that the US has long produced some of the best long/short managers. However, over the past five years, some of the brightest talents in this space are found in Europe. They have managed to generate positive alpha on both their long and short positions, while skillfully adjusting their net exposure, an advantage often linked to the smaller size of their funds. Still, the capacity of these strategies remains limited due to low scalability tied to liquidity, restricting access to these opportunities. The best way to tap this potential is to invest in a collective vehicle specialising in Europe, with strong expertise in selecting and monitoring the top European managers. However, access to these funds often remains limited to a select circle, as they are frequently closed to new investors.

Notably, the GRANOLAS (Europe’s equivalent of America’s “Magnificent Seven”) have started to underperform the Stoxx 600 since early April, creating greater dispersion and a more favorable environment for selecting long and short positions. With Europe once again facing geopolitical tensions and the persistent risk of deglobalisation, it might just be time to reconsider European long/short strategies.

Protected: NS Webinar – Hedge Fund Investing in 2025

This content is password-protected. To view it, please enter the password below.

Protected: NS Macro Outlook & Investment Opportunities

This content is password-protected. To view it, please enter the password below.

Chart of the Month – Building the perfect mousetrap for capturing alpha

Chart of the Summer – Building the perfect mousetrap for capturing alpha


Hedge fund performance overall has been disappointing this year with the HFRX Global Hedge Fund Index barely turning positive YTD as of the end of June. With your typical Balanced 60/40 portfolio up just under 10% YTD (BUT still underwater over the last 2 years!) and cash rates above 5%, hedge funds are facing a big challenge this year as the bogey has changed in the last 9 months. This year has clearly been a year for more directional equity long short managers and less so for market neutral given how narrowly led the market has been (and not only in the US with its Magnificent Seven). In addition to the lack of breadth in the market, the bi-polar factor rotation and sector re-positioning (chronic over the last few years) has caught many managers off guard (blame it on the quant funds – mostly stat arb).

Building a longstanding legacy that is built to last with a clear succession plan to compound returns with consistency over time is more challenging for investment managers that become victims of their success than it is for consumer brands, with the inevitable style drift that comes with a successful track record, as they take in more assets than they can manage, which is the ultimate nail on the coffin. The alternative: the multi-PM model which offers decentralized portfolio management with no single risk-taker able to rock the boat, combined with centralized risk management and the ability to scale in size (to a certain point) where investment opportunities arise. This model has been around since the end of the 1980s and has proved itself over time in compounding consistent returns beyond traditional benchmark indices. This month’s chart compares the Barclays Multimanager Index of 42 multi-PM platforms versus the HFRX Global Hedge Fund Index and highlights why this model has been so successful with investors (mostly pension funds, sovereign wealth funds and private banks). It should be of no surprise that most of the growth in the $4 Trio. hedge fund industry over the last few years has been in the multi-PM space given their ability in providing consistent risk-adjusted performance and more importantly their capacity to protect capital during market drawdowns in comparison to multi-strategy funds led by a single PM that sooner or later stumble and fall before re-jigging their strategy. Their capability in identifying talent and allocating capital efficiently across various strategies has proved itself to a point where the competition for talent has reached extremes and has become a game of musical chairs. Poaching traders between multi-PM platforms has now become like paying for star football players (which does not necessarily guarantee the success of a team, but who cares, if they can score big on their own).  The success of the multi-PM platform model can be further illustrated by the number of PMs that have left some of the oldest and most successful platforms over the last 25 years following a so-called stellar track record but then fail to deliver when they launch on their own. There are countless examples of these which attest to the robustness in the construct of the multi-PM platform.

The significant rise in the risk-free rate of late has somewhat challenged a platform’s ability to generate a high Sharpe ratio in addition to the subpar performance as traditional sub-strategy buckets are not working as well YTD. The most common allocations by sub-strategy within a multi-PM structure and the reason for their underperformance YTD are: Fundamental Equity Long Short (market neutral strategies are going through one of the worst years due to massive short squeezes), Discretionary Macro (tough year to call the direction of rates unless you focus on EM), Merger Arbitrage (less deals as money is no longer cheap and the regulator has taken a tougher stance), Capital Markets (the IPO/SPAC market has dried up and not many new deals) and Systematic Macro (tough year to catch trends and have completely missed the equity market rally). What has worked this year has been Global Credit, Fixed Income RV, Convertibles and unsurprisingly Commodities (where most multi-PM platforms are less exposed). Quant strategies have had mixed results but are an inherent part of the build as a diversifier of alpha sources but often plagued by “love / hate” relationships until they get thrown out and replaced down the line with a new team if they underperform over time. They are, however, better able to perform during periods of market volatility given their shorter-term time horizon.

One could say that there are way too many hedge funds today (more than the 16,041 Starbucks stores in the US alone!) fishing in the same pond for the most part i.e. the US equity market where the number of listed companies has drastically fallen from over 8,000 companies (at its peak in 1996) down to 3,700 today (thanks to private equity groups or bankruptcies). You have the same number of stocks listed in Japan today so go figure why there are barely any hedge funds left trading out of Tokyo (the capital of equity market neutral strategies)! Finding 50 of the best capacity constrained sector PMs is easy but getting 250 is more difficult with the inherent risk of diworsification. The big question today is whether the multitude of multi-PM platforms are arbitraging themselves out. The fact that they have increasing amounts of capital under management, which must be deployed across the same popular sectors and in liquid stocks, have all ended up trading the same equity names. In addition, the average holding period of a stock in the US is down to 10 months down from 5 years back in the 70s. Not surprising that we occasionally see a platform winding down a sector or sub-strategy pod which has breached its risk limits and has had to liquidate, creating a ripple effect across other multi-PM platforms which in turn are forced by their risk control teams to cut risk. The inherent leverage used within these platforms (which varies widely amongst them) to enable them to increase alpha only amplifies the ripple effect.

The big dilemma for platforms today is whether to onboard managers to have exclusivity (which comes at a price and with no performance guarantee) or work with outside independent managers and/or the sell-side. External Alpha-capture programs were first pioneered by Marshall Wace back in 2001 (initially started as a summer internship project) to enable buy-side firms to track and analyze the sell-side’s best ideas. At the time the average lifespan of a contributor was and still is around 4-5 years. Compared to the average lifespan of a PM within one of the oldest multi-pm structures today, it is now down to 17 months (Darwinism!). Perhaps the platforms concentrated down to 20-30 PMs (like the traditional fund of funds model) will do better but their capacity will be constrained. We will always be reminded that size is your biggest enemy. With at least ten new platforms slated to launch this year, the trend is far from over.

Ultimately, it is more of an art than a science and as one manager told me back in the 90s “we all use the same ingredients but it’s the recipe that makes the difference…”


Past performance is not indicative of future results. The views, strategies and financial instruments described in this document may not be suitable for all investors. Opinions expressed are current opinions as of date(s) appearing in this material only. References to market or composite indices, benchmarks or other measures of relative market performance over a specified period of time are provided for your information only. NS Partners provides no warranty and makes no representation of any kind whatsoever regarding the accuracy and completeness of any data, including financial market data, quotes, research notes or other financial instrument referred to in this document. This document does not constitute an offer or solicitation to any person in any jurisdiction in which such offer or solicitation is not authorized or to any person to whom it would be unlawful to make such offer or solicitation. Any reference in this document to specific securities and issuers are for illustrative purposes only, and should not be interpreted as recommendations to purchase or sell those securities. References in this document to investment funds that have not been registered with the FINMA cannot be distributed in or from Switzerland except to certain categories of eligible investors. Some of the entities of the NS Partners Group or its clients may hold a position in the financial instruments of any issuer discussed herein, or act as advisor to any such issuer.  Additional information is available on request.
© NS Partners Group

Chart of the Month – Global macro hedge fund managers are back in the game

Global macro hedge fund managers are back in the game

Source: AQR

The end of the free money era & the return of macro uncertainty

The last 3 years have seen the world significantly change in terms of geopolitics, climate change actions and investment outlook. Following the GFC in 2008, central banks took the lead to support financial markets by injecting massive liquidity in the system. Coordinated central bank actions were multiplied when the COVID outbreak hit the world in March 2020. One of the main consequences is that high inflation is finally back and monetary policy needs to be dramatically reversed. The era of free money has now ended and so has the low volatility market regime for all asset classes. Market volatility can be measured in a number of ways. In the chart above, the well-known quant manager AQR tries to identify regimes of ‘macro turmoil’, where macro turmoil is defined as any 12-month period where the magnitude of macro news is higher than average. They measure macro news using changes in real GDP growth and inflation, and also surprises (vs. economist forecasts) in real GDP growth, inflation and industrial production. Since 2020 we are back in this so-defined macro turmoil environment. These periods could last long like during the 70s and the 80s or around the GFC[1], periods which have been strong years for global macro managers.

Higher volatility expected to remain

Swings in monetary policy expectations are likely to remain an important market driver in 2023, meaning that equity-bond correlations could remain high. This is what happened this year, with the 60/40 model portfolio showing its worst return for 80 years! Looking forward, the multiple risk factors – hawkish central banks, structural inflation, bursting bubbles, slowing economy, energy crisis, geopolitical tensions, industrial disruption, growing social unrest – do not necessarily mean that markets will go down but they will probably remain volatile. During sharp market corrections, volatility tends to spike, liquidity dries out and correlations increase suddenly, which could lead to forced deleveraging.

More risks but also more opportunities

In this context, uncorrelated hedge fund strategies such as global macro should be well indicated to help diversify portfolios. Macro managers take long and short positions across a range of liquid asset classes (rates, equity indices, currencies, credit indices and commodities) mainly through futures and options to try to generate attractive decorrelated returns over time. They are up on average between +11.4% and +23.1% YTD as of the end of October (returns of the HFRI Macro index and the CS Macro HF index) having made money mainly shorting rates and being long the USD. They tend to show positive returns during market dislocations. Historically, when implied volatility has been high (VIX above 25), equities have been down on average -11.3%, while macro strategies have generated +6.1% annualized returns (source UBS HF PB).

Flexibility and tight risk management are the key of their success

The advantage of global macro is the flexibility of the mandate. They can invest in all asset classes, but where the opportunities are. In a highly volatile environment, the probability of getting good entry/exit points is higher. A global macro manager is successful in producing good risk-adjusted returns over time if he has a good risk management framework and particular attention is made on this aspect in their due diligence process. Sitting with high levels of unencumbered cash, now yielding 4%, they are now paid to wait and engage risk when they see interesting investment opportunities. In conclusion, the continuation of a tight monetary policy and a high volatility regime should prove favorable for macro managers in 2023.

[1] Global Financial Crisis

Note

Hedge Fund indices: HFRI Macro Total index (HFRIMI Index), Credit Suisse Global Macro index (HEDGGLMA Index).


Past performance is not indicative of future results. The views, strategies and financial instruments described in this document may not be suitable for all investors. Opinions expressed are current opinions as of date(s) appearing in this material only. References to market or composite indices, benchmarks or other measures of relative market performance over a specified period of time are provided for your information only. NS Partners provides no warranty and makes no representation of any kind whatsoever regarding the accuracy and completeness of any data, including financial market data, quotes, research notes or other financial instrument referred to in this document. This document does not constitute an offer or solicitation to any person in any jurisdiction in which such offer or solicitation is not authorized or to any person to whom it would be unlawful to make such offer or solicitation. Any reference in this document to specific securities and issuers are for illustrative purposes only, and should not be interpreted as recommendations to purchase or sell those securities. References in this document to investment funds that have not been registered with the FINMA cannot be distributed in or from Switzerland except to certain categories of eligible investors. Some of the entities of the NS Partners Group or its clients may hold a position in the financial instruments of any issuer discussed herein, or act as advisor to any such issuer.  Additional information is available on request.

© NS Partners Group

Chart of the Month – The contribution of alternative investments to asset allocation

The contribution of alternative investments to asset allocation

Source: Bloomberg, NS Partners

The debate around inflation is raging these days. While the arguments in favor of temporary inflation clash with those advocating the return of higher structural inflation, it is clear that the narrative of the US central bank has considerably evolved in recent months. To the point that some analysts are now wondering if the Fed simply made a major error of judgment that could lead to serious corrections in financial markets. In the short term the Fed is so “behind the curve” that it has no other choice but to start raising its key rates in March. It is also surprising to see such divergence between DM and EM central banks which already started their rate hike cycle for months. As we are writing these lines, the Fed is still injecting liquidity into markets! However, inflation is mainly a US problem today (with the exception of specific cases such as Turkey and its unorthodox monetary policy, or significant increase in European energy prices) with the combination of several factors: ultra-accommodative monetary policy, unprecedented fiscal stimulus, strong economic growth, excess household savings and record low unemployment rate leading to upward pressure on wages. On top of that, we have the China factor. Indeed, the “zero COVID” policy pursued by the Chinese authorities, coupled with relatively low herd immunity and a less effective vaccine, are causing repeated partial shutdowns of the Chinese economy. The impact on supply chains, particularly for the production of consumer goods for Western countries, is being felt. While headline inflation is quite low in China, inflation on production costs is up more than 10% year-on-year.

This situation will push the central banks of developed countries, and first and foremost the Fed, to raise rates very quickly. The rate and amplitude are difficult to predict, but the direction is clear. There are several consequences in terms of asset allocation and portfolio managers can’t remain insensitive to this change in the macroeconomic environment.

  • Regarding equities, value sectors are now significantly outperforming growth sectors, which had been the big winners of the pandemic and the last decade. Sector exposures will be key in such a macro-driven market environment going forward. With more than 10 rotations in 2021, equity markets have not been so easy to navigate. The performance of the indices can mask certain realities and the Nasdaq, which gained 22% in 2021, would only be up 9% in its 5 largest capitalizations. It seems to us that a “blended” approach with a selection of good quality companies is the right approach at this stage.
  • Regarding bonds, it seems almost impossible to expect a decent return without taking risks for which we are not paid for. The period of free money has lasted so long that certain economic realities will resurface with the end of this era and we don’t see why private debt markets would be immune to the rise in rates.

Over the past 10 years, the classic 60/40 portfolio model, i.e. 60% allocation in equities and 40% in bonds, has generated satisfactory risk-adjusted performance, but we can legitimately doubt that it will be the case for the coming months. In this context, “relative value” strategies seem particularly interesting to consider. Their objective is to deliver consistent performances, decorrelated from markets, with low volatility. There are 2 main relative value strategies:

  1. Multi-strategy multi-PM platforms, which tend to be large by assets and able to attract the best traders in the world and
  2. Smaller managers who implement niche strategies on specific market segments. With an in-depth knowledge of this investment universe, an efficient selection process and capacity to invest with the best managers, NS Partners has been able to build robust portfolios, which have delivered “all weather” returns for more than 20 years.

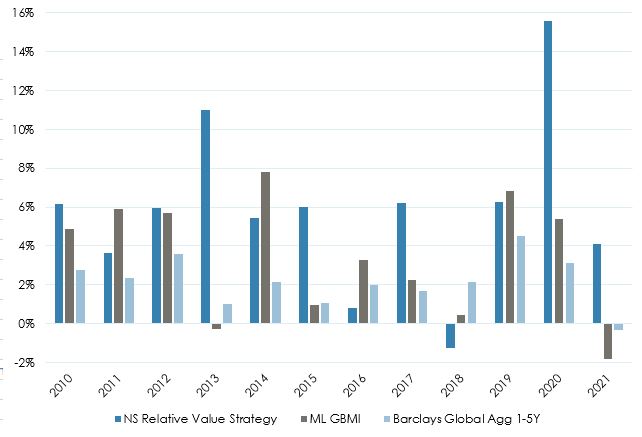
The chart above shows annual performances of the NS “relative value” strategy compared to the BoA-ML Global Bond and Barclays Global Aggregate 1-5Y bond indices:

  • Over the past 12 years, the strategy has posted a net average annual performance of +5.8%, compared to +3.4% and +2.2% for the two indices.
  • The annualized volatility of the strategy is only 3.1% and shows no correlation with bond markets.
  • Even more interesting, when we consider the 10 months when the US 10-year interest rate increased the most, the strategy posted an average performance of +0.96% while the BoA-ML Global Bond index posted exactly the same average performance in absolute value but with a negative sign, -0.96%!

And if you are not convinced by the past, consider the present. The Bloomberg 60/40 index lost 4.2% in January 2022 whereas the NS RV strategy is estimated to be slightly down for the month.


Past performance is not indicative of future results. The views, strategies and financial instruments described in this document may not be suitable for all investors. Opinions expressed are current opinions as of date(s) appearing in this material only. References to market or composite indices, benchmarks or other measures of relative market performance over a specified period of time are provided for your information only. NS Partners provides no warranty and makes no representation of any kind whatsoever regarding the accuracy and completeness of any data, including financial market data, quotes, research notes or other financial instrument referred to in this document. This document does not constitute an offer or solicitation to any person in any jurisdiction in which such offer or solicitation is not authorized or to any person to whom it would be unlawful to make such offer or solicitation. Any reference in this document to specific securities and issuers are for illustrative purposes only, and should not be interpreted as recommendations to purchase or sell those securities. References in this document to investment funds that have not been registered with the FINMA cannot be distributed in or from Switzerland except to certain categories of eligible investors. Some of the entities of the NS Partners Group or its clients may hold a position in the financial instruments of any issuer discussed herein, or act as advisor to any such issuer.  Additional information is available on request.

© NS Partners Group

Chart of the Month – The contribution of alternative investments to asset allocation

The contribution of alternative investments to asset allocation

Source: Bloomberg, NS Partners

The debate around inflation is raging these days. While the arguments in favor of temporary inflation clash with those advocating the return of higher structural inflation, it is clear that the narrative of the US central bank has considerably evolved in recent months. To the point that some analysts are now wondering if the Fed simply made a major error of judgment that could lead to serious corrections in financial markets. In the short term the Fed is so “behind the curve” that it has no other choice but to start raising its key rates in March. It is also surprising to see such divergence between DM and EM central banks which already started their rate hike cycle for months. As we are writing these lines, the Fed is still injecting liquidity into markets! However, inflation is mainly a US problem today (with the exception of specific cases such as Turkey and its unorthodox monetary policy, or significant increase in European energy prices) with the combination of several factors: ultra-accommodative monetary policy, unprecedented fiscal stimulus, strong economic growth, excess household savings and record low unemployment rate leading to upward pressure on wages. On top of that, we have the China factor. Indeed, the “zero COVID” policy pursued by the Chinese authorities, coupled with relatively low herd immunity and a less effective vaccine, are causing repeated partial shutdowns of the Chinese economy. The impact on supply chains, particularly for the production of consumer goods for Western countries, is being felt. While headline inflation is quite low in China, inflation on production costs is up more than 10% year-on-year.

This situation will push the central banks of developed countries, and first and foremost the Fed, to raise rates very quickly. The rate and amplitude are difficult to predict, but the direction is clear. There are several consequences in terms of asset allocation and portfolio managers can’t remain insensitive to this change in the macroeconomic environment.

  • Regarding equities, value sectors are now significantly outperforming growth sectors, which had been the big winners of the pandemic and the last decade. Sector exposures will be key in such a macro-driven market environment going forward. With more than 10 rotations in 2021, equity markets have not been so easy to navigate. The performance of the indices can mask certain realities and the Nasdaq, which gained 22% in 2021, would only be up 9% in its 5 largest capitalizations. It seems to us that a “blended” approach with a selection of good quality companies is the right approach at this stage.
  • Regarding bonds, it seems almost impossible to expect a decent return without taking risks for which we are not paid for. The period of free money has lasted so long that certain economic realities will resurface with the end of this era and we don’t see why private debt markets would be immune to the rise in rates.

Over the past 10 years, the classic 60/40 portfolio model, i.e. 60% allocation in equities and 40% in bonds, has generated satisfactory risk-adjusted performance, but we can legitimately doubt that it will be the case for the coming months. In this context, “relative value” strategies seem particularly interesting to consider. Their objective is to deliver consistent performances, decorrelated from markets, with low volatility. There are 2 main relative value strategies:

  1. Multi-strategy multi-PM platforms, which tend to be large by assets and able to attract the best traders in the world and
  2. Smaller managers who implement niche strategies on specific market segments. With an in-depth knowledge of this investment universe, an efficient selection process and capacity to invest with the best managers, NS Partners has been able to build robust portfolios, which have delivered “all weather” returns for more than 20 years.

The chart above shows annual performances of the NS “relative value” strategy compared to the BoA-ML Global Bond and Barclays Global Aggregate 1-5Y bond indices:

  • Over the past 12 years, the strategy has posted a net average annual performance of +5.8%, compared to +3.4% and +2.2% for the two indices.
  • The annualized volatility of the strategy is only 3.1% and shows no correlation with bond markets.
  • Even more interesting, when we consider the 10 months when the US 10-year interest rate increased the most, the strategy posted an average performance of +0.96% while the BoA-ML Global Bond index posted exactly the same average performance in absolute value but with a negative sign, -0.96%!

And if you are not convinced by the past, consider the present. The Bloomberg 60/40 index lost 4.2% in January 2022 whereas the NS RV strategy is estimated to be slightly down for the month.


Past performance is not indicative of future results. The views, strategies and financial instruments described in this document may not be suitable for all investors. Opinions expressed are current opinions as of date(s) appearing in this material only. References to market or composite indices, benchmarks or other measures of relative market performance over a specified period of time are provided for your information only. NS Partners provides no warranty and makes no representation of any kind whatsoever regarding the accuracy and completeness of any data, including financial market data, quotes, research notes or other financial instrument referred to in this document. This document does not constitute an offer or solicitation to any person in any jurisdiction in which such offer or solicitation is not authorized or to any person to whom it would be unlawful to make such offer or solicitation. Any reference in this document to specific securities and issuers are for illustrative purposes only, and should not be interpreted as recommendations to purchase or sell those securities. References in this document to investment funds that have not been registered with the FINMA cannot be distributed in or from Switzerland except to certain categories of eligible investors. Some of the entities of the NS Partners Group or its clients may hold a position in the financial instruments of any issuer discussed herein, or act as advisor to any such issuer.  Additional information is available on request.

© NS Partners Group

Chart of the Month – The contribution of alternative investments to asset allocation

The contribution of alternative investments to asset allocation

Source: Bloomberg, NS Partners

The debate around inflation is raging these days. While the arguments in favor of temporary inflation clash with those advocating the return of higher structural inflation, it is clear that the narrative of the US central bank has considerably evolved in recent months. To the point that some analysts are now wondering if the Fed simply made a major error of judgment that could lead to serious corrections in financial markets. In the short term the Fed is so “behind the curve” that it has no other choice but to start raising its key rates in March. It is also surprising to see such divergence between DM and EM central banks which already started their rate hike cycle for months. As we are writing these lines, the Fed is still injecting liquidity into markets! However, inflation is mainly a US problem today (with the exception of specific cases such as Turkey and its unorthodox monetary policy, or significant increase in European energy prices) with the combination of several factors: ultra-accommodative monetary policy, unprecedented fiscal stimulus, strong economic growth, excess household savings and record low unemployment rate leading to upward pressure on wages. On top of that, we have the China factor. Indeed, the “zero COVID” policy pursued by the Chinese authorities, coupled with relatively low herd immunity and a less effective vaccine, are causing repeated partial shutdowns of the Chinese economy. The impact on supply chains, particularly for the production of consumer goods for Western countries, is being felt. While headline inflation is quite low in China, inflation on production costs is up more than 10% year-on-year.

This situation will push the central banks of developed countries, and first and foremost the Fed, to raise rates very quickly. The rate and amplitude are difficult to predict, but the direction is clear. There are several consequences in terms of asset allocation and portfolio managers can’t remain insensitive to this change in the macroeconomic environment.

  • Regarding equities, value sectors are now significantly outperforming growth sectors, which had been the big winners of the pandemic and the last decade. Sector exposures will be key in such a macro-driven market environment going forward. With more than 10 rotations in 2021, equity markets have not been so easy to navigate. The performance of the indices can mask certain realities and the Nasdaq, which gained 22% in 2021, would only be up 9% in its 5 largest capitalizations. It seems to us that a “blended” approach with a selection of good quality companies is the right approach at this stage.
  • Regarding bonds, it seems almost impossible to expect a decent return without taking risks for which we are not paid for. The period of free money has lasted so long that certain economic realities will resurface with the end of this era and we don’t see why private debt markets would be immune to the rise in rates.

Over the past 10 years, the classic 60/40 portfolio model, i.e. 60% allocation in equities and 40% in bonds, has generated satisfactory risk-adjusted performance, but we can legitimately doubt that it will be the case for the coming months. In this context, “relative value” strategies seem particularly interesting to consider. Their objective is to deliver consistent performances, decorrelated from markets, with low volatility. There are 2 main relative value strategies:

  1. Multi-strategy multi-PM platforms, which tend to be large by assets and able to attract the best traders in the world and
  2. Smaller managers who implement niche strategies on specific market segments. With an in-depth knowledge of this investment universe, an efficient selection process and capacity to invest with the best managers, NS Partners has been able to build robust portfolios, which have delivered “all weather” returns for more than 20 years.

The chart above shows annual performances of the NS “relative value” strategy compared to the BoA-ML Global Bond and Barclays Global Aggregate 1-5Y bond indices:

  • Over the past 12 years, the strategy has posted a net average annual performance of +5.8%, compared to +3.4% and +2.2% for the two indices.
  • The annualized volatility of the strategy is only 3.1% and shows no correlation with bond markets.
  • Even more interesting, when we consider the 10 months when the US 10-year interest rate increased the most, the strategy posted an average performance of +0.96% while the BoA-ML Global Bond index posted exactly the same average performance in absolute value but with a negative sign, -0.96%!

And if you are not convinced by the past, consider the present. The Bloomberg 60/40 index lost 4.2% in January 2022 whereas the NS RV strategy is estimated to be slightly down for the month.


Past performance is not indicative of future results. The views, strategies and financial instruments described in this document may not be suitable for all investors. Opinions expressed are current opinions as of date(s) appearing in this material only. References to market or composite indices, benchmarks or other measures of relative market performance over a specified period of time are provided for your information only. NS Partners provides no warranty and makes no representation of any kind whatsoever regarding the accuracy and completeness of any data, including financial market data, quotes, research notes or other financial instrument referred to in this document. This document does not constitute an offer or solicitation to any person in any jurisdiction in which such offer or solicitation is not authorized or to any person to whom it would be unlawful to make such offer or solicitation. Any reference in this document to specific securities and issuers are for illustrative purposes only, and should not be interpreted as recommendations to purchase or sell those securities. References in this document to investment funds that have not been registered with the FINMA cannot be distributed in or from Switzerland except to certain categories of eligible investors. Some of the entities of the NS Partners Group or its clients may hold a position in the financial instruments of any issuer discussed herein, or act as advisor to any such issuer.  Additional information is available on request.

© NS Partners Group

Notz Stucki – An alternative investment pioneer.

What are our strengths in the alternative investment market?

Some answers from our Head of Alternative Investments, Cédric Dingens, in a short video: “Hedge funds – Managers that stand out from the crowd”.


Past performance is not indicative of future results. The views, strategies and financial instruments described in this document may not be suitable for all investors. Opinions expressed are current opinions as of date(s) appearing in this material only.

References to market or composite indices, benchmarks or other measures of relative market performance over a specified period of time are provided for your information only. Notz, Stucki provides no warranty and makes no representation of any kind whatsoever regarding the accuracy and completeness of any data, including financial market data, quotes, research notes or other financial instrument referred to in this document.

This document does not constitute an offer or solicitation to any person in any jurisdiction in which such offer or solicitation is not authorized or to any person to whom it would be unlawful to make such offer or solicitation. Any reference in this document to specific securities and issuers are for illustrative purposes only, and should not be interpreted as recommendations to purchase or sell those securities. References in this document to investment funds that have not been registered with the FINMA cannot be distributed in or from Switzerland except to certain categories of eligible investors. Some of the entities of the Notz Stucki Group or its clients may hold a position in the financial instruments of any issuer discussed herein, or act as advisor to any such issuer.

 Additional information is available on request.

© Notz Stucki Group


Lynx, Best Multi-Manager Fund – Equity Hedge

Lynx, Best Multi-Manager Fund – Equity Hedge

We are proud to announce that Long/Short Selection – Lynx was selected as the Best Multi-Manager Fund – Equity Hedge category during the Hedgeweek European Virtual Awards Networking Ceremony 2021.


33 years in the making and seven consecutive years of winning awards for this fund must be close to a record. To tweak a quote from Sean Connery: “We have not aged but matured!” We will continue to strive as one of the only fund of funds dedicated to European managers left as many of our competitors have given up. A big thank you to all our investors, colleagues and supporters!