Chart of the Month – FED vs Growth for Emerging Markets

FED vs Growth for Emerging Markets
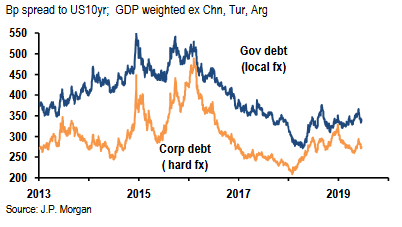
We are generally not fan of discussing EM as a single group as countries’ profiles and reaction functions are increasingly different from a country to another. But for the sake of simplification in this monthly chart we would assume so.

So which EM asset class would benefit most in the context of renewed global monetary easing? That would not only depend on short-term rates at the FED and the ECB. For EM currencies, as the FED move dovish, all major EM central banks are also expected to cut their policy rates. While the possible FED resumption of an easing cycle has recently pushed most EM currencies higher, the next leg up might take some time to materialise. The market might now wait for actual cut to materialise and growth to improve (including some sort of trade tensions resolution or truce between the US and China). The other ingredient needed to support EM currencies and local debt more generally, is inflation which in both the US and EM (collectively or individually) should stay contained.

For EM credit, a mild or even sluggish growth would be enough for the asset class to keep performing in the context of dovish central banks and contained inflation.

The real underperformer so far is EM equity and more specifically Asia Equity complex. In the case of EM equity, a higher inflation would be much better absorbed if growth rebounds and trade conflict is contained or resolved.
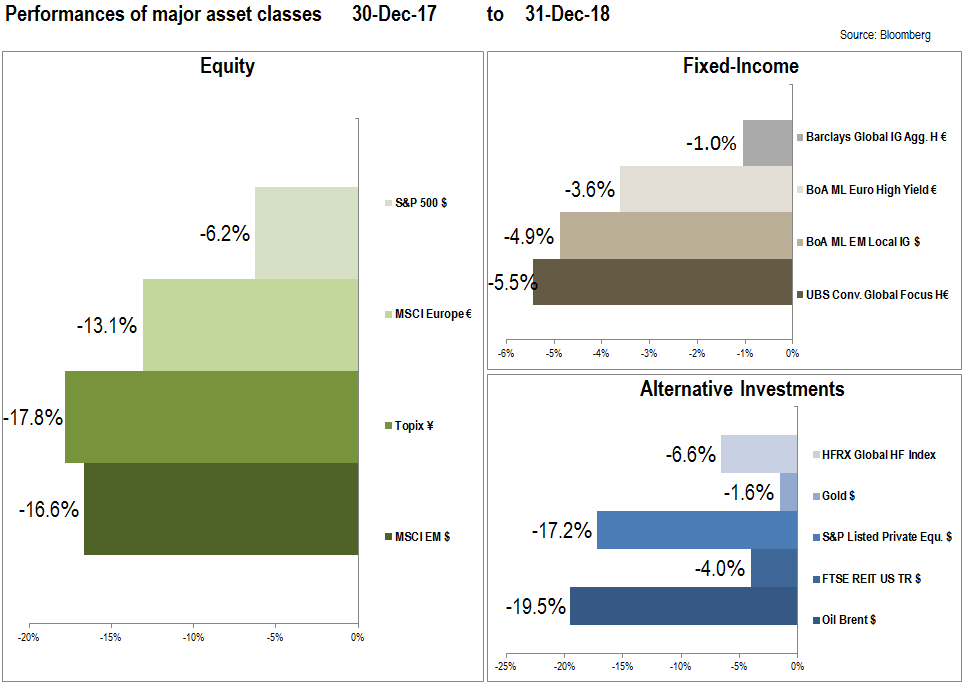
Chart of the Month – 2018: No place to hide to make money. 2019: Typically, reversion.

2018: No place to hide to make money. 2019: Typically, reversion.

During 2018, all major asset classes delivered negative returns as can be seen above.

EQUITIES

2018: Starting valuations were very demanding. During the year, equity investors were scared by the coming slowdown (some even talk about recession), the US-China trade war, the FED tightening process, the Italian risk, etc.
2019: With valuations already attractive (SP500 PE12Month: 14.6x; MSCI Europe: 12.1x; Topix: 11.3x; EM: 10.6x), we may see the reversal of 2018, as we do not expect a recession but a slowdown in the world economy.

FIXED INCOME

2018: The high valuations at the beginning of the year, the tightening of the FED, the fear to a large economic slowdown, the problems in some emerging markets and the problems of the Italian economy (Italy is one of the largest issuer of bonds in the world) put all the fixed-income indexes in negative territory.
2019: Central banks will continue with the tightening process, so it is still uncertain what government bond bond indexes will do. Credit related assets look more attractive with spreads in the high yield space at around 5.0%, which are interesting with our view of a slowdown, but not a recession.

ALTERNATIVE INVESTMENTS

2018: Alternative investments were not the positive alternative to traditional assets. Hedge Funds and private equity are not able to weather the storm when all the markets are down. Gold did not hedge the portfolios as it does not perform well when rates hike. REITS were also negative in a rate hike environment. Oil was the worst performer with an unbalanced supply-demand, and geopolitics impacting the price in non-predictable ways.
2019: Hedge funds and private equity (more correlated with traditional assets) are likely to revert the losses of 2018. Difficult to predict what gold and REITS will do as monetary tightening is likely to continue. Oil prices have probably reached a bottom level.

CONCLUSION

2018 was the “annus horribilis” of the capital markets with no place to hide to make money. 2019 has started with attractive valuations and some challenges (US-China trade war, Brexit, Central banks tightening). If history is any guide, we may say that after such a bad year, the market delivers good returns the following one. Our view is that we are facing a slowdown in the economy, but markets are incorporating prices that reflect a dramatic slowdown close to a recession.