Il bear market obbligazionario – analisi dei principali avvenimenti della settimana
Il bear market obbligazionario – analisi dei principali avvenimenti della settimana
La Banca Centrale Europea, la scorsa settimana, con l’obiettivo di far rientrare l’inflazione della zona euro verso il target del 2%, ha confermato un primo rialzo dei tassi di interesse di riferimento a luglio di 25 punti base e, se non dovesse migliorare la situazione inflazionistica europea, potrebbe spingere per un ulteriore aumento di 50 punti nel mese di settembre. Un altro argomento della riunione dello scorso 9 giugno ha riguardato la conclusione del programma di acquisti netti di attività nell’ambito dell’Asset Purchase Programme (APP), dal primo luglio 2022.
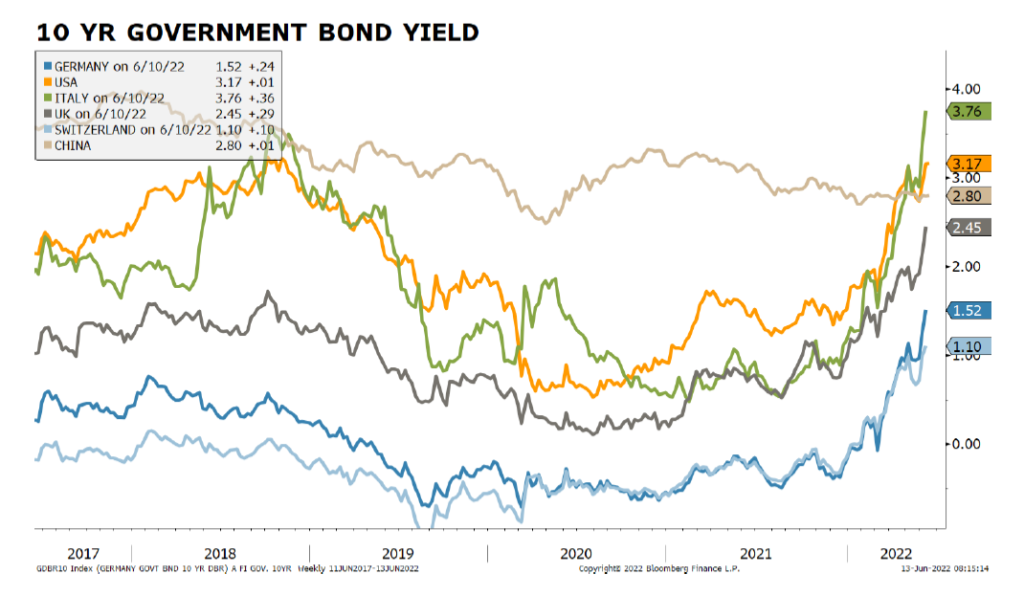
L’uscita di questa notizia, combinata alla prospettiva di rialzi sempre più aggressivi da parte della Federal Reserve, ha provocato importanti ribassi sui mercati. Se da un lato gli indici azionari sono stati penalizzati ampiamente da queste misure, dall’altro anche l’obbligazionario, considerato erroneamente più sicuro, ha subito notevoli ribassi, come avevamo già precedentemente anticipato. Ad esempio, i titoli di stato a 10 anni di Germania e Italia hanno registrato perdite di valore da inizio anno alla giornata del 14 giugno, rispettivamente di circa il 17% e il 27%. Infatti, come si può evincere dal grafico sopra riportato, vediamo che, essendosi ridotto il prezzo dei titoli obbligazionari già in circolazione, i rendimenti dei titoli di stato sono saliti notevolmente. I Buoni del Tesoro Poliennali a dieci anni, ad esempio, questa settimana hanno superato il 4,2% di rendimento annualizzato, rendendoli nuovamente attrattivi per quegli investitori che cercano un buon ritorno dall’obbligazionario (non considerando l’inflazione). A seguito delle tensioni accumulate, la BCE ha indetto quindi una riunione straordinaria per calmare i mercati da eventi speculativi che potessero riguardare i paesi europei più esposti a livello di debito sovrano, dando mandato per la creazione di uno strumento anti-spread dei vari paesi europei e prolungando il reinvestimento del PEPP fino alla fine del 2024, in modo che il rallentamento economico, provocato anche dalla politica monetaria restrittiva, non si acuisca in certi paesi rispetto ad altri. In particolare, i titoli in scadenza verranno reinvestiti in maniera flessibile nel debito di quei paesi considerati più a rischio, dove la misura è stimata valere tra i 200 e i 250 miliardi di euro nell’arco di 12 mesi. Dunque, si tenterà di evitare una frammentazione tra i vari stati, consentendo una efficace trasmissione della politica monetaria perseguita dalla BCE.
Fonti: NS Partners, Investing.com, Sole24Ore, Banca centrale europea
Di seguito l’ultima nota settimanale del nostro ufficio di Milano.
Nota settimanale 17.06.2022
- Panoramica macro
- Il bear market obbligazionario – analisi dei principali avvenimenti della settimana
- Come gli eventi dell’ultima settimana hanno influenzato il mercato azionario
Disclaimer
Le performance passate non sono in nessun caso indicative per i futuri risultati. Le opinioni, le strategie ed i prodotti finanziari descritti in questo documento possono non essere idonei per tutti gli investitori. I giudizi espressi sono valutazioni correnti relative solamente alla data che appare sul documento. Questo documento non costituisce in alcun modo una offerta o una sollecitazione all’investimento in nessuna giurisdizione in cui tale offerta e/o sollecitazione non sia autorizzata né per nessun individuo per cui sarebbe ritenuta illegale. Qualsiasi riferimento contenuto in questo documento a prodotti finanziari e/o emittenti è puramente a fini illustrativi, ed in nessun caso deve essere interpretato come una raccomandazione di acquisto o vendita di tali prodotti. I riferimenti a fondi di investimento contenuti nel presente documento sono relativi a fondi che possono non essere stati autorizzati dalla Finma e perciò possono non essere distribuibili in o dalla svizzera, ad eccezione di alcune precise categorie di investitori qualificati. Alcune delle entità facenti parte del gruppo NS Partners o i suoi clienti possono detenere una posizione negli strumenti finanziari o con gli emittenti discussi nel presente documento, o ancora agire come advisor per qualsiasi degli emittenti stessi. I riferimenti a mercati, indici, benchmark, cosi come a qualsiasi altra misura relativa alla performance di mercato su uno specifico periodo di riferimento, sono forniti esclusivamente a titolo informativo. Il contenuto di questo documento è diretto ai soli investitori professionali come definiti ai sensi della direttiva Mifid, quali banche, imprese di investimento, altri istituti finanziari autorizzati o regolamentati, imprese di assicurazione, organismi di investimento collettivo e società di gestione di tali fondi, i negoziatori per conto proprio di merci e strumenti derivati su merci, soggetti che svolgono esclusivamente la negoziazione per conto proprio su mercati di strumenti finanziari e che aderiscono indirettamente al servizio di liquidazione, nonché al sistema di compensazione e garanzia; altri investitori istituzionali, agenti di cambio e non è da intendersi per l’uso di investitori al dettaglio. Accettando questi termini e condizioni, l’utilizzatore conferma e comprende che sta agendo come investitore professionale o suo rappresentante e non come investitore al dettaglio. Informazioni aggiuntive disponibili su richiesta
© NS Partners Group