What duration for a bond portfolio?
What duration for a bond portfolio?
A few thoughts as the FED prepares to launch its rate-cutting cycle.
Duration back in the spotlight
Since the financial crisis of 2008 and the economic repression introduced by central banks through their quantitative easing programmes, long-dated bonds had lost some of their appeal. The last remaining attraction disappeared in the aftermath of the Covid crisis, when the same central banks injected massive amounts of liquidity into the market, sending bond yields falling. In fact, it hardly seemed relevant to invest in long-term bonds with yields close to zero. Since 2021, however, we have seen a paradigm shift, with the return of inflation forcing the Fed, in particular, to raise its key rates to an extent never seen before. Today, the US central bank is about to embark on a cycle of rate cuts (which have remained unchanged at around 5.25% since July 2023), against the backdrop of an economic slowdown marked by a weaker job market. These fears about growth are finally driving down the correlation between equities and bonds and, in this context, duration is once again becoming an attractive option for building an investment portfolio.
Favour short to intermediate durations
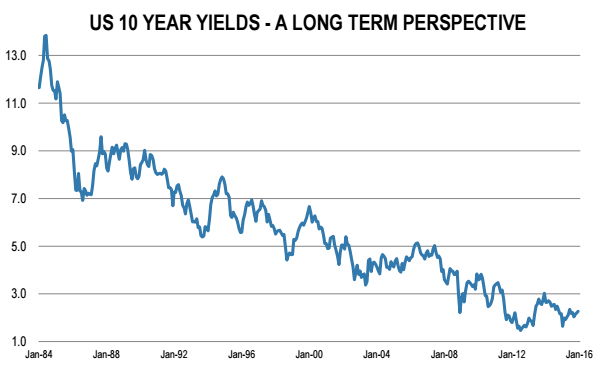
For the sake of simplicity, let’s focus on developed markets and run the US 10-year yield as a proxy for longer-dated bonds. To mechanically determine a theoretical target value for this yield, we can start from the FED’s neutral key rate, given by its last dot plot in June (2.8%) and add a time premium to it, which will vary according to the reference period and which is justified in particular by the uncertainties linked to future inflation. Historically, this premium between the Fed’s key rate and US 10-year yields has been between 1% and 2% or between 0.5% and 1.5% since the 2008 financial crisis. Taking averages, we can therefore conclude that the US 10-year yield should be 4.3%, if we assume that we are moving away from the paradigm that has prevailed since the financial crisis, or 3.8%, if we assume that we are still in a similar context. At the time of writing, the US 10-year yield is 3.66%. We can therefore conclude that, in theory and in the absence of a hard landing marked by a recession in the United States, long-term bond prices (which move inversely to yields) are slightly overvalued by the market. On top of this, the fundamentals are not very reassuring about the sustainability of the US budget, with deficits comparable to those in the days following the Second World War. Investing in this type of investment therefore does not seem appropriate.
A more reasonable option, and one that nevertheless adds a little duration to a portfolio, would be to opt for a short to intermediate duration. Here, we can run the 2-year rate, for example. Replicating the same analysis as for long rates, we obtain a historical time premium of 0.5% to 1% and almost zero for the period following the financial crisis, which gives us theoretical target values of between 2.8% and 3.55% depending on the macroeconomic context, whereas the current yield is 3.56%. We can see here that the market value and the theoretical price are more in line and that there is even an opportunity if we stay in a market similar to the post-financial crisis period.
The investor’s context
In reality, there is no exact universal solution when it comes to choosing duration within a portfolio, as each portfolio has its own characteristics to meet the needs of the client. An approach that favours the long end of the curve may still be justified, for example to hedge the risk associated with a portfolio that has a high exposure to cyclical equities. First and foremost, you need to identify the risk and return constraints specific to each portfolio before making your choice. It is also important to take a macroeconomic view when deciding on the time premium to be added to the target return for each maturity. These points are not intended to be exhaustive, but they should help bond investors in their allocation decisions at a time when duration is finally regaining popularity.
Past performance is not indicative of future results. The views, strategies and financial instruments described in this document may not be suitable for all investors. Opinions expressed are current opinions as of date(s) appearing in this material only. References to market or composite indices, benchmarks or other measures of relative market performance over a specified period of time are provided for your information only. NS Partners provides no warranty and makes no representation of any kind whatsoever regarding the accuracy and completeness of any data, including financial market data, quotes, research notes or other financial instrument referred to in this document.
This document does not constitute an offer or solicitation to any person in any jurisdiction in which such offer or solicitation is not authorized or to any person to whom it would be unlawful to make such offer or solicitation. Any reference in this document to specific securities and issuers are for illustrative purposes only, and should not be interpreted as recommendations to purchase or sell those securities. References in this document to investment funds that have not been registered with the FINMA cannot be distributed in or from Switzerland except to certain categories of eligible investors. Some of the entities of the NS Partners Group or its clients may hold a position in the financial instruments of any issuer discussed herein, or act as advisor to any such issuer. Additional information is available on request.
© NS Partners Group