Gráfico del mes – Estar o no estar en un mercado alcista

Estar o no estar en un mercado alcista

Source: NS Partners, Bloomberg

Tras unos resultados negativos en 2022, los mercados bursátiles mundiales están subiendo a buen ritmo desde principios de año. La única excepción es China, donde la recuperación macroeconómica sigue decepcionando a los inversores. Pero si consideramos los mercados desarrollados, el índice S&P 500 ha subido un +8,9% YTD a finales de mayo, el índice MSCI Europe un +6,6% y el índice Topix un +12,6%.

A pesar de las incertidumbres en el frente macroeconómico (ralentización económica, Alemania en recesión técnica, disminución de la inflación pero aún en niveles elevados, tensiones geopolíticas), la volatilidad del mercado se ha debilitado significativamente (el índice VIX y las marcas recientes del VStoxx se acercan a 15, cuando durante los últimos meses estuvieron respectivamente por encima de 20 y 25 la mayor parte del tiempo). La situación no es tan grave como se pensaba inicialmente, en particular si nos fijamos en los beneficios empresariales, pero sigue siendo realmente sorprendente ver al índice S&P 500 completamente inmune a la quiebra de grandes bancos estadounidenses en marzo, cuando al mismo tiempo el rendimiento de la deuda pública estadounidense a 2 años bajó del 5,2% al 3,9% en 2 días, ¡una amplitud no vista desde octubre de 1987!

De hecho, están ocurriendo muchas cosas en segundo plano, este año, el mercado en general se ha visto impulsado únicamente por unos pocos valores tecnológicos estadounidenses de gran capitalización relacionados con la inteligencia artificial. El gráfico muestra el diferencial de rentabilidad interanual entre el S&P 500 de ponderación igual y el S&P 500 de ponderación por capitalización bursátil. La diferencia nunca había sido tan amplia desde 1990.

¿Cómo se comportan los gestores activos en este entorno de mercado? Sin sorpresa, asistimos a una dispersión muy elevada entre gestores, en función de su posicionamiento sectorial, preferencia por las pequeñas o grandes capitalizaciones, orientación al crecimiento o al valor, concentración y, por último, selección de valores. Lo que es tranquilizador es el hecho de que nuestra selección de gestores de selección de valores, en los que tenemos una gran convicción y que sufrieron el año pasado, han vuelto con fuerza: Blackrock Global Unconstrained sube +20,5% YTD & -25,5% en 2022, Cantillon +10,7% & -23,4% en 2022, y AKO +16,8% & -18,5% en 2022. Ya se ha recuperado una parte importante de las pérdidas de 2022, mientras que el índice MSCI World ha subido un 7,6% hasta la fecha tras perder un 19,5% en 2022, lo que representa sólo un 39%.

En cuanto a los gestores de renta variable long/short, vuelven a estar en territorio positivo en términos de generación de alfa. En Asia y China, la mayoría de ellos han sido capaces de protegerse eficazmente de las caídas y nuestro enfoque de diversificación ha ayudado. En mercados desarrollados, a medida que el ciclo de subidas de tipos de los bancos centrales parece acercarse a su fin en EE.UU. y muestra una trayectoria más visible en Europa, los fundamentales vuelven a ser determinantes. Nuestro mandato europeo long/short ha subido un 9% hasta la fecha, lo que constituye un buen resultado si se tiene en cuenta que los gestores están bien diversificados en términos de sectores y son bastante prudentes en cuanto a la exposición al mercado.

Tener carteras de renta variable gestionadas por el riesgo en este contexto tiene sentido.


Los resultados pasados no implican resultados futuros. Las opiniones, estrategias e instrumentos financieros que se describen en el presente documento pueden no ser convenientes para todos los inversores. Las opiniones expresadas son sólo las del momento en la(s) fecha(s) que aparece(n) en este material. Las referencias a índices de mercado o compuestos, índices de referencia u otras medidas de resultados relativos de los mercados durante un período específico sólo se proveen a título informativo. NS Partners no garantiza ni es responsable de la exactitud o la integridad de las informaciones (datos financieros de mercado, precios de bolsa, resultados de investigación u otros instrumentos financieros) que se mencionan en este documento. El presente documento no constituye una oferta ni solicitud a ninguna persona ni jurisdicción donde tal oferta o solicitud no esté autorizada ni a ninguna persona a quien sería ilegal hacer dicha oferta o solicitud. Toda referencia en este documento a instrumentos específicos o a emisores sólo tiene una finalidad ilustrativa y no debe ser interpretada como una recomendación para la compra o venta de dicho instrumento. Las referencias en este documento a fondos de inversión se aplican a fondos que no han sido registrados por la Finma y que por lo tanto no pueden ser distribuidos en o desde suiza excepto a ciertas categorías de inversores. Algunas de las empresas del grupo NS Partners o sus clientes pueden tener posiciones en los instrumentos financieros de alguno de los emisores mencionados en este documento, o ser asesor de uno de ellos. Hay información adicional disponible a solicitud.

© Grupo NS Partners

Chart of the Month – To be or not to be in a bull market

Chart of the Month – To be or not to be in a bull market

Source: NS Partners, Bloomberg

Following sharp negative performances in 2022, global stock markets are nicely up since the beginning of the year. The only exception is China, where the macroeconomic recovery continues to disappoint investors. But if we consider developed markets, the S&P 500 index is up +8.9% YTD as of the end of May, the MSCI Europe index +6.6% and the Topix index +12.6%.

Despite more uncertainties on the macroeconomic front (economic slowdown, Germany in technical recession, inflation declining but still at high levels, continued geopolitical tensions) market volatility has weakened significantly (VIX index and VStoxx recent marks are closed to 15 when they were respectively above 20 and 25 most of the time during recent months). The situation is not as worse as people thought initially, in particular if we look at corporate earnings, but it is still really surprising to see the S&P 500 index completely immune to the bankruptcy of large US banks in March when at the same time the US 2Y Government bond yield went down from 5.2% to 3.9% in 2 days, an amplitude not seen since October 1987!

In fact, there is a lot happening behind the scenes and the overall market has been driven by only a very few large US mega-cap AI-related Tech stocks this year. The chart shows the YTD return differential between the S&P 500 equal-weighted and the S&P 500 market-cap weighted. The gap has actually never been so large since 1990!

How do active managers perform in this current market environment? Without surprise, we witness a very high dispersion between managers, depending on their sector positioning, small or large-cap bias, growth or value orientation, concentration and finally stock picking. What is reassuring is the fact that our selection of stock pickers where we have high conviction and who suffered last year are strongly back: Blackrock Global Unconstrained is up +20.5% YTD & -25.5% in 2022, Cantillon +10.7% & -23.4% in 2022, and AKO +16.8% & -18.5% in 2022. A significant proportion of 2022 losses have already been recouped whereas the MSCI World index is up +7.6% YTD after losing -19.5% in 2022, which represents only 39%!

With regards to long/short equity managers, they are back in positive territory in terms of alpha generation. In Asia and China, most of them have been able to protect efficiently on the downside and our diversification approach has helped. In DM, as central banks’ hiking rate cycle seems to be closer to the end in the US and shows a more visible path in Europe, fundamentals make the difference again. Our European long/short mandate is up +9% YTD, which is a good result considering that managers are well diversified in terms of sectors and rather cautious in terms of market exposure.

Having equity risk-managed portfolios in this context makes sense.


Past performance is not indicative of future results. The views, strategies and financial instruments described in this document may not be suitable for all investors. Opinions expressed are current opinions as of date(s) appearing in this material only. References to market or composite indices, benchmarks or other measures of relative market performance over a specified period of time are provided for your information only. NS Partners provides no warranty and makes no representation of any kind whatsoever regarding the accuracy and completeness of any data, including financial market data, quotes, research notes or other financial instrument referred to in this document. This document does not constitute an offer or solicitation to any person in any jurisdiction in which such offer or solicitation is not authorized or to any person to whom it would be unlawful to make such offer or solicitation. Any reference in this document to specific securities and issuers are for illustrative purposes only, and should not be interpreted as recommendations to purchase or sell those securities. References in this document to investment funds that have not been registered with the FINMA cannot be distributed in or from Switzerland except to certain categories of eligible investors. Some of the entities of the NS Partners Group or its clients may hold a position in the financial instruments of any issuer discussed herein, or act as advisor to any such issuer.  Additional information is available on request.
© NS Partners Group

Chart of the Month – Nifty – But not fifty

Chart of the month: Nifty – But not fifty

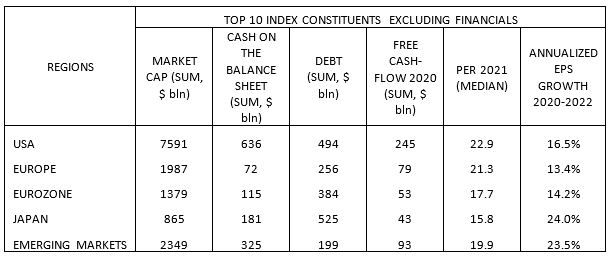
In this strange and hectic year for markets, giving ammunition to both bulls and bears, eyeballing the top ten constituents of major equity indices gives an indication of what can be expected, and at what cost, for the coming months: in the table below, we highlight different metrics for the US, Europe, the Eurozone, Japan and Emerging Markets.

First of all, what is striking in this table is the size and the quality characteristics of the US market: its largest companies’ market caps exceed the sum of all the others. The cash on their balance sheets and their free cash-flow generation almost match the sum of all the others, and their debt load is by far lower than the sum of all the others. This comes at a price, as their median PER exceeds the others as well.
Another remarkable fact is that Emerging Markets largest companies tend, for the majority of them, to also fall into the “Quality” side of equities, thanks to the IT heavyweights which did not show up some years ago (Alibaba, Tencent, TSMC, JD.com, just to cite a few). Thanks to this, the top constituents of EM share with their US counterparts some interesting features: cash exceeds debt, and just two years of free cash-flow suffice to pay down the entire debt burden. What a contrast with the Eurozone or Japan! And the reason for that is simple: there are still four “Value” or “Cyclical” companies in this top ten in the Eurozone (Total, Siemens, Bayer and Enel), and two in Japan (Toyota and Honda). The lower valuation of these markets seems justified.
And finally, if it is met, the median annualized EPS growth for the next two years looks appealing for all regions. Although it compares favorably for Japan, especially in relation to valuation, this must be relativized by the fact that there are two car manufacturers distorting the numbers here.
With these metrics, large caps equities don’t seem overvalued in general, whatever the region. On top of that, there are probably less risks of missed earnings expectations with the current large weighting in non-cyclical sectors, notably in the US and in Emerging Markets, and an optimistic investor can even hope for a stronger than expected economic rebound that would favor markets like Japan or the Eurozone. The US mega caps seem to be the less prone to bad surprises considering their solid balance sheets and high cash generation, which probably explains their higher valuation. But still, today’s valuations of highly popular stocks in the US are by no means comparable to the nifty fifty bubble, in particular when taking their growth prospects into consideration.
A blended and global approach in terms of stock-picking appears to be the best strategy when it comes to large cap investing going forward, with reasonable probabilities of generating pleasant risk-adjusted returns, especially when compared with other asset classes. Despite all the headwinds, the common wisdom that good things happen to good and well managed companies still prevails.


Past performance is not indicative of future results. The views, strategies and financial instruments described in this document may not be suitable for all investors. Opinions expressed are current opinions as of date(s) appearing in this material only.

References to market or composite indices, benchmarks or other measures of relative market performance over a specified period of time are provided for your information only. Notz, Stucki provides no warranty and makes no representation of any kind whatsoever regarding the accuracy and completeness of any data, including financial market data, quotes, research notes or other financial instrument referred to in this document.

This document does not constitute an offer or solicitation to any person in any jurisdiction in which such offer or solicitation is not authorized or to any person to whom it would be unlawful to make such offer or solicitation. Any reference in this document to specific securities and issuers are for illustrative purposes only, and should not be interpreted as recommendations to purchase or sell those securities. References in this document to investment funds that have not been registered with the FINMA cannot be distributed in or from Switzerland except to certain categories of eligible investors. Some of the entities of the Notz Stucki Group or its clients may hold a position in the financial instruments of any issuer discussed herein, or act as advisor to any such issuer.

 Additional information is available on request.

© Notz Stucki Group

Notz Stucki Investment Meeting – Anatole Kaletsky

“Bull Market Will Continue – despite all the risks”

2018 has been a difficult year in financial markets with almost every equity and bond market suffering, with the notable exception of the US stock market. A further complication for investors has been that this has not been caused by a serious deterioration in economic fundamentals. Instead markets have been driven by political risks and uncertainties. Ultimately the question for investors is whether this is just a painful correction, and therefore a buying opportunity, or is this the start of a reversal in markets, signalling the end of the US bull market. The presentation considered three causes of the setback in markets since April/May, and then how far these issues might develop or revert. Anatole made a case that the bull market would resume, but cautioned that others in Gavekal were more cautious.

Please click here to read the entire notes.

Hedge Funds: Myth Vs Reality

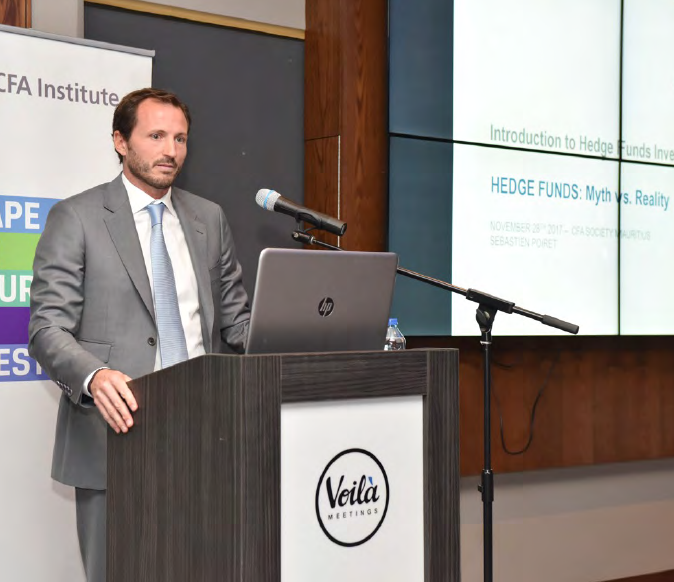
La CFA Society of Mauritius et Notz Stucki Origins Limited ont fait une présentation sur le thème ‘Hedge Funds : Myth vs Reality’. Sébastien Poiret, Managing Director de Notz Stucki Origins, a dressé un tableau de la performance de ces fonds tout en évoquant l’environnement de « bull market », qui persiste depuis neuf ans maintenant au niveau des marchés actions. Il explique aussi pourquoi peu de ces fonds investissent, pour l’instant, sur la Bourse de Maurice.

Sébastien Poiret, Managing Director de Notz Stucki Origins

En termes simples, expliquez-nous ce que c’est que les ‘hedge funds’.

Ce type de fonds est un fonds d’investissement qui peut faire de l’argent quand les marchés montent, ce qu’on appelle le ‘long side’. Là où c’est particulièrement intéressant, c’est qu’il est aussi censé faire de l’argent quand les marchés baissent, ce qu’on appelle le ‘short side’, et a la possibilité d’utiliser un peu d’effets de levier. Donc, prendre un peu plus de risques sans forcément investir uniquement dans les actions et les obligations. Mais il peut aussi investir dans les marchés de devises et de matières premières. Il y a plus de 30 stratégies différentes. Cela donne beaucoup plus de flexibilité que les investissements traditionnels en actions et obligations. Il permet, sur de longues périodes, de surperformer les marchés des actions avec moins de risques ; ce qu’on appelle la volatilité, et moins de corrélation.

Vous avez débuté votre présentation en citant « l’environnement actuel », et en utilisant des termes comme « bulle ». Que devons-nous comprendre ?

Cela fait maintenant neuf ans que nous sommes dans un environnement de « bull market » pour les marchés des actions. Ce cycle dure, en général, entre cinq et huit ans. Celui-ci est un peu plus long que d’habitude. Ce qui n’est peut-être pas surprenant puisque la crise de 2008 a été tellement violente que le cycle est désormais plus long. On commence effectivement à avoir des bulles qui nous font peur, notamment dans les marchés obligataires, les marchés de crédit où les sociétés à haut rendement se refinancent à hauteur de 2 ou 3% en Europe. Ce qui paraît complètement fou. Il faut comprendre aussi que le cycle actuel ne va pas durer indéfiniment, et que l’intérêt et l’appétit pour les ‘hedge funds’, à travers des fonds de ‘hedge funds’, sont en train de revenir.

Pour reprendre une question d’une personne dans l’audience, devons-nous nous attendre à un crash comme en 2008, et éventuellement un impact sur les ‘hedge funds’?

Un crash comme 2008… Pas forcément. Pour l’instant, tous les signaux sont au vert. La croissance mondiale est bonne et elle est synchronisée. Les résultats des entreprises sont bons. L’inflation est contenue. Donc, l’environnement actuel est bon et nous ne serions pas surpris que la hausse des marchés continue. Pour l’année prochaine, le risque principal, c’est l’inflation. Pour l’instant, elle nous surprend tous, car elle reste contenue. Mais si jamais elle grimpe, les banques centrales devront être plus actives et donc plus restrictives ; ce qui pourrait impacter les marchés obligataires et de crédit.

Maintenant on est persuadé que l’industrie des fonds alternatifs est beaucoup mieux positionnée actuellement qu’en 2008 parce qu’elle a appris de ses erreurs. Donc, pour vous donner une idée sur les portefeuilles équilibrés de nos clients, nous avons investi jusqu’à 30% dans ces fonds à travers nos fonds de ‘hedge funds’, dont le plus ancien a 43 ans de « track record ».

Justement, vous dites que l’industrie a appris de « ses erreurs ». Quelles ont été ces erreurs ?

Il y en a trois principales. La première, c’est le levier. L’industrie utilise beaucoup moins de leviers qu’en 2008, et les banques leur offrent moins de leviers. Deuxièmement, ces fonds utilisent maintenant plusieurs ‘prime brokers’, et donc ne dépendent pas d’un seul ‘prime broker’ qui, à l’époque, le forçait à vendre leurs positions au milieu de la crise. Enfin, beaucoup de ces ‘fund managers’ ont aussi appris des erreurs d’investir dans des investissements non liquides, qui sont devenus des investissements importants suite à des performances négatives et des rédemptions. Nous sommes vraiment confortables aujourd’hui avec un portefeuille de ‘hedge funds’ diversifié qui ne gagnera pas forcément de l’argent si une crise similaire à 2008 se reproduirait, mais qui ferait beaucoup mieux qu’en 2008.

Les marchés émergents intéressent-ils toujours les investisseurs ?

Depuis un an et demi, oui. Depuis que les marchés émergents ont bien rebondi, la liquidité est de retour. La croissance des bénéfices est aussi réelle et les valorisations sont encore intéressantes. Donc, on ne serait pas surpris que les marchés émergents – à condition que le dollar ne remonte pas trop et que les taux d’intérêts aux états-Unis ne remontent pas trop non plus, car les pays émergents, très sensibles au dollar et au taux d’intérêt, continuent de bien « performer ».

Est-ce que, finalement, l’industrie des ‘hedge funds’ reste une industrie compliquée et difficile à comprendre ?

C’est une industrie qui est plus complexe et plus sophistiquée ; mais à partir du moment où on a l’expertise, les bonnes équipes de gestion et les bons processus, nous sommes très confortables. Toutefois, il faut être très sélectif. Nous faisons du ‘due diligence’ au niveau de l’investissement, et au niveau opérationnel parce que le ‘hedge fund’, ce n’est pas uniquement investir de l’argent. C’est aussi gérer une société. On veut s’assurer que dans un ‘hedge fund’, il y a le Chief Executive Officer (CEO) qui s’occupe de la société, un Chief Operating Officer pour les opérations, un Chief Risk Officer indépendant en plus, naturellement, du CIO et des Portfolio Managers qui prennent les décisions d’investissements. Certains « hedge funds » ont plusieurs centaines d’employés.

Nous faisons en plus de ces deux « due diligence » de l’analyse quantitative/statistique sur les performances passées. Ce sont donc trois équipes différentes et trois rapports différents qui permettent à nos Portfolio Managers de prendre les décisions d’investir dans des ‘hedge funds’. Nous avons des contacts très réguliers avec eux, notamment en allant les visiter sur place plusieurs fois par an, que ce soit à Londres, à New York ou en Asie.

Donc, oui, de loin, ça paraît effectivement assez opaque et compliqué. Mais quand on a fait ça depuis plus de 40 ans, et surtout qu’on a investi depuis 40 ans dans les fonds alternatifs, on les comprend bien.

Messieurs Notz et Stucki ont eu la chance et le flair d’investir avec Georges Soros au début des années 70, et qui est devenu, depuis, le ‘hedge fund manager’ qui a connu le plus de succès. Ils ont été, avec d’autres partenaires en Suisse, les pionniers des fonds de fonds alternatifs.

Où se situe Maurice à l’échelle internationale par rapport à l’industrie de ces fonds?

Il y a très peu de ces fonds qui investissent sur la Bourse mauricienne. Plus le marché local va se développer, plus le marché va devenir liquide et plus certains ‘hedge funds’ vont investir dans la Bourse locale au niveau des actions, mais aussi à terme au niveau des obligations. Dans la région, il existe un certain nombre de ces fonds en Afrique du Sud, qui traitent le marché local. Il y a des fonds qui investissent dans l’Afrique subsaharienne. Il existe, dans la région, peu d’investisseurs dans ces fonds. Il y en a eu en 2008, et certains ont été déçus. On est persuadé que, même dans la région, l’intérêt pour les ‘hedge funds’ ne va que grandir dans les mois et les années à venir.

Parlez-nous de Notz Stucki Origins, et de votre stratégie qui, à ce qu’on comprend, est principalement régionale.

Notz Stucki Origins est une ‘joint-venture’ entre le groupe Notz Stucki (USD 9 milliards d’actifs sous gestion) et Origins Limited, le ‘family office’ de M. Gauthier Ismail. En tant que société de gestion indépendante, nous gérons de la clientèle locale et régionale et proposons à nos clients de réinvestir une partie de leurs avoirs dans leurs pays d’ «Origins ».


Texte: Herrsha Lutchman-Boodhun