When science meets art: choosing the right manager.
When science meets art: choosing the right manager.
Managing a multi hedge fund managers portfolio or a fund of funds, generally implies that, as the manager of such portfolio, you need to consider 3 main characteristics during your selection process from an investment point of view, (leaving aside the operational aspects intentionally for now).
- Quality
- Risk/return profile
- Individual correlation
The first one is universal and resides in the intrinsic quality of a hedge fund manager, meaning his ability to generate consistent returns in line with his proposed strategy specifications and within a corresponding time horizon. It also takes into consideration the pedigree of the main decision maker, the experience and competence of the research team.
However, this intrinsic quality leaves quite some room for interpretation as for the investment rational, since this hedge fund will be part of whole group supposedly targeting a certain return objective and potentially a risk constraint. Picking a hedge fund exclusively on these terms may have, however, undesirable impacts.
Therefore 2 other characteristics? come to consideration in that context, so to maintain the integrity of the pool and to contribute to your diversification requirements.
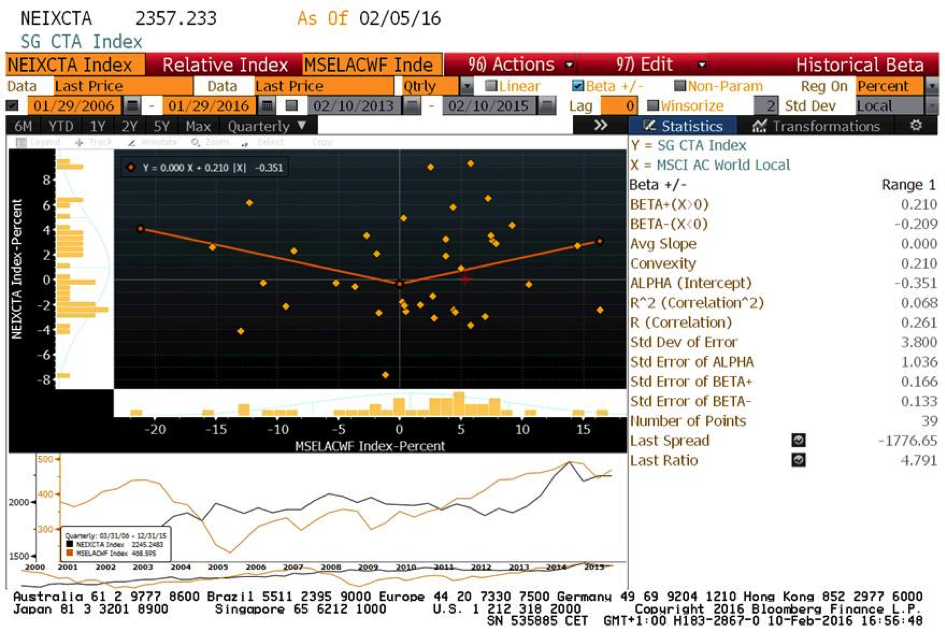
The first one relates to the risk/return profile of the hedge fund you are selecting. This profile provides a strong indicator as per its return capability vs. its risk level, often looked at as its volatility of returns. The more the profile is detached from the other components of the portfolio, the more diversification it is expected to contribute to the portfolio. The Sharpe ratio is an indicator of such profile, but it is not sufficient to identify the hedge fund actual positioning vs. your other investments (Graph 1).

Graph 1: Risk Return Profile. Source: NS Partners
The second characteristic is the individual correlation of the hedge fund you are selecting to each of the other components of the portfolio. The lower the correlation the better additional contribution to diversification this new hedge fund brings to the mix. It is generally accepted that a correlation of 0.5 or lower is preferable, a negative correlation being considered as the best possible situation, all other conditions being validated, i.e profitable with an acceptable level of risk (Table 1).
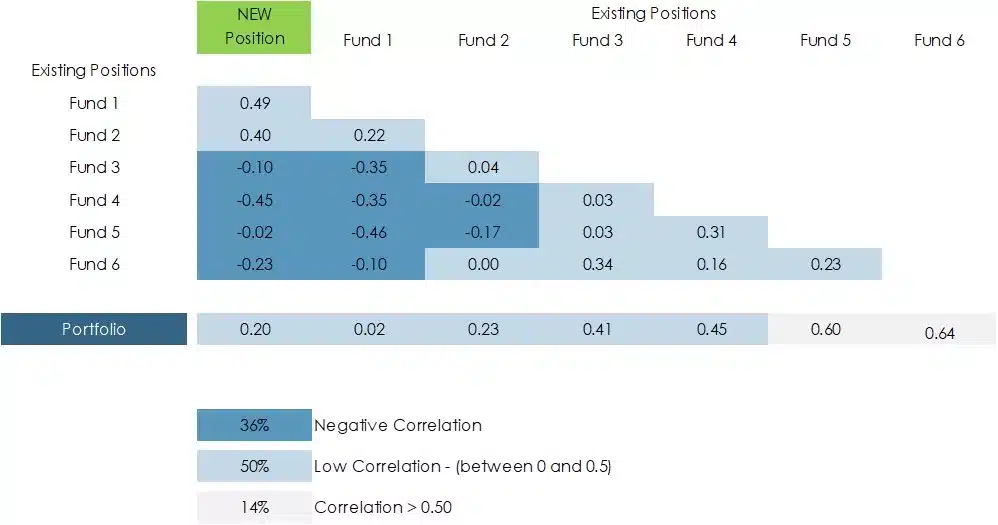
Table 1 : Correlation analysis. Source: Ns Partners
From there, one need to appreciate that these characteristics bear some subjective factors, not in absolute terms since a ratio is a ratio. But it is only a ratio. Meaning that as a portfolio manager of a fund of funds you still decide what ratio is acceptable and in what range of profile and correlation do you allow your portfolio to be allocated to. I can’t deny that a few years of experience, multiple market cycles proven resilience are co-substantial to rational choices. Nevertheless, it is probably where science meets art.
Past performance is not indicative of future results. The views, strategies and financial instruments described in this document may not be suitable for all investors. Opinions expressed are current opinions as of date(s) appearing in this material only. References to market or composite indices, benchmarks or other measures of relative market performance over a specified period of time are provided for your information only. NS Partners provides no warranty and makes no representation of any kind whatsoever regarding the accuracy and completeness of any data, including financial market data, quotes, research notes or other financial instrument referred to in this document. This document does not constitute an offer or solicitation to any person in any jurisdiction in which such offer or solicitation is not authorized or to any person to whom it would be unlawful to make such offer or solicitation. Any reference in this document to specific securities and issuers are for illustrative purposes only, and should not be interpreted as recommendations to purchase or sell those securities. References in this document to investment funds that have not been registered with the FINMA cannot be distributed in or from Switzerland except to certain categories of eligible investors. Some of the entities of the NS Partners Group or its clients may hold a position in the financial instruments of any issuer discussed herein, or act as advisor to any such issuer. Additional information is available on request.
© NS Partners Group