Global equities: fundamental shift or temporary setback?
Global Equities: Fundamental Shift or Temporary Setback?
Since January, equity markets have shown signs of weakness and, more importantly, have seen a change in leadership.
The contrast between the global equity market dynamics of 2024 and the first four months of 2025 is striking: performance in USD for major indices such as the S&P 500 and MSCI World is negative or near zero. Moreover, due to the marked weakness of the US dollar this year, returns turn clearly negative when measured in EUR or CHF. This is the first observation. But beneath the surface, the changes are even more profound.
The decline of former leaders
Indeed, the major winners of previous years, most notably the so-called “Magnificent 7,” are now struggling. As of April 30 2025, all of them have posted negative returns in USD year-to-date, placing them deeply in the red when measured in EUR or CHF.
The investment plans announced by the Magnificent 7 for the 2024 – 2029 period are of unprecedented scale.
Why the reversal?
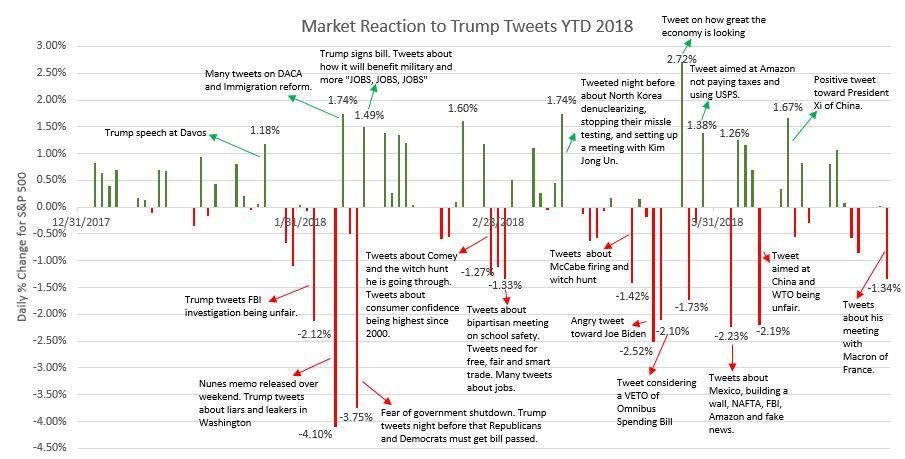
Certainly, uncertainties surrounding Donald Trump’s proposed tariff policies or his intentions to influence Federal Reserve decisions may have had an impact. However, it’s important to note that the weakness in the Magnificent 7 predates these announcements. In fact, by the end of April, much of the market losses linked to the U.S. President’s statements had already been recouped. This challenges the notion that recent market turbulence is solely attributable to political or trade-related tensions.
Early warning signs as of late 2024
While the Magnificent 7 are not a homogeneous group, each with distinct business models, two key observations were already evident by the end of 2024:
- Stretched, sometimes very high valuations. Enthusiasm and perhaps exaggerated optimism surrounding Artificial Intelligence contributed to a valuation premium for these leaders, particularly as they collectively displayed enviable levels of profitability and dominant market positions.
- Sharply rising capital intensity. Since 2014, the gross value of property, plant and equipment at these firms has often increased more than tenfold. This reflects massive investments in cloud infrastructure and AI.
Massive Capex: a structural shift
On this second point, it is noteworthy that the ratio of Fixed Assets to Revenue has frequently tripled over the past decade, in some cases rising from 35% to 100%. In other words, whereas it took 35 cents of “industrial tooling” to generate 1 dollar of revenue in 2014, it now requires 1 dollar.
This trend shows no signs of slowing. The investment plans announced by the Magnificent 7 for the 2024 – 2029 period are historically large. At the same time, maintenance capex will also weigh on free cash flows.
This is why financial analysis typically does not award high valuation premiums to companies with high capital intensity, extreme examples being sectors such as steelmaking or automobile manufacturing, which are also highly sensitive to economic cycles.
Solid fundamentals, but a logical reassessment
Of course, the business outlook for the Magnificent 7 remains robust and upcoming earnings should remain strong. However, this year’s relatively disappointing market performance is more likely the result of a reassessment of their valuations than a questioning of their fundamentals.
Toward thoughtful diversification
An international equity portfolio can hardly afford to exclude all these companies. However, their relative weight deserves to be reconsidered in light of the evolution of their balance sheets and investment outlook.
There are numerous investment opportunities in global equities beyond the Magnificent 7, whether in Europe or the United States. In today’s context of high valuations and uncertainty around global economic growth, rigorous analysis of business models, margin sustainability, valuations and balance sheet quality is more essential than ever.
Past performance is not indicative of future results. The views, strategies and financial instruments described in this document may not be suitable for all investors. Opinions expressed are current opinions as of the date(s) appearing in this material only. References to market or composite indices, benchmarks or other measures of relative market performance over a specified period of time are provided for your information only. NS Partners provides no warranty and makes no representation of any kind whatsoever regarding the accuracy and completeness of any data, including financial market data, quotes, research notes or other financial instruments referred to in this document. This document does not constitute an offer or solicitation to any person in any jurisdiction in which such offer or solicitation is not authorized or to any person to whom it would be unlawful to make such offer or solicitation. Any reference in this document to specific securities and issuers are for illustrative purposes only, and should not be interpreted as recommendations to purchase or sell those securities. References in this document to investment funds that have not been registered with the Finma cannot be distributed in or from Switzerland except to certain categories of eligible investors. Some of the entities of the NS Partners group or its clients may hold a position in the financial instruments of any issuer discussed herein, or act as advisor to any such issuer. Additional information is available on request. © NS Partners Group