July General Market Comments

July General Market Comments

« Whose Side Are You On? » – Matt Bianco, 1984

Are you on the optimists’ or the pessimists’ side? Or rather on the side of those who have no idea?

So far, 2022 tends to plead in favour of the pessimists, but optimists could argue that July 2022 was the best month for the S&P 500 since November 2020 (when Pfizer-BioNTech announced they had a vaccine against Covid), and those who have no idea could point out that finally markets were roughly flat for June-July 2022, as June was a dreadful month.

There are many things to factor in, and all of them give arguments to one side or another: inflation is high, but expected to normalize, especially since Central Banks seem keen on tackling it rapidly; geopolitics are a mess with not only the conflict between Russia and Ukraine, but also the heightened tensions between the US and China regarding Taiwan; corporate and private debt does not seem to be a source of problems today, but Government debt across developed markets is immense; earnings reports have been surprisingly good so far, but they are expected to slow down significantly going forward; commodities do not move in sync, but there seems to be a growing threat from Russia about gas deliveries in Europe for this winter, triggering skyrocketing gas prices. With all this happening at the same time, it is not easy to choose your side and it’s not surprising to see numerous experts change their minds, depending on the most recent events.

Buoyed by convincing earnings releases and some more risk appetite, equity markets soared in July: the MSCI World gained +7.86%, the S&P 500 +9.11%, the Nasdaq +12.55%, the MSCI Europe +7.52% and the Topix +3.71%. The only detractor was Emerging Markets, down 0.69%. As nominal and real yields fell, Growth outperformed Value with a +11.51% return for the MSCI World Growth versus +4.44% for its Value counterpart.

In such a risk-prone month, Credit also rose (+3.06% for the Itraxx Crossover), and Government yields fell (-36 bps for the US 10 year, -52 bps for Germany); Gold and Oil receded by 2.29% and 6.75% respectively, and the Euro fell further against the dollar (-2.51%), weakened by the possible looming energy crisis in Europe and an unfavourable interest rate differential.

That’s it for this month’s Market Comments, stay tuned, markets never skip a beat.


Past performance is not indicative of future results. The views, strategies and financial instruments described in this document may not be suitable for all investors. Opinions expressed are current opinions as of date(s) appearing in this material only. References to market or composite indices, benchmarks or other measures of relative market performance over a specified period of time are provided for your information only. NS PARTNERS SA provides no warranty and makes no representation of any kind whatsoever regarding the accuracy and completeness of any data, including financial market data or other financial instruments referred to in this general comment. This document does not constitute an offer or solicitation to any person in any jurisdiction in which such offer or solicitation is not authorized or to any person to whom it would be unlawful to make such offer or solicitation. Any reference in this document to specific securities and issuers are for illustrative purposes only, and should not be interpreted as recommendations to purchase or sell those securities. References in this document to investment funds that have not been registered with the FINMA cannot be distributed in or from Switzerland except to certain categories of eligible investors. Some of the entities of the NS Partners Group or its clients may hold a position in the financial instruments of any issuer discussed herein, or act as advisor to any such issuer. Additional information is available on request. © NS Partners Group

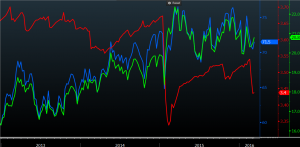
Chart of the Month – Shifting gears in the equity markets

Shifting gears in the equity markets

Source: Bloomberg, IBES, NS Partners

The two main drivers of equity markets are liquidity (provided by the Central Banks) and earnings (provided by corporations). When both drivers are favourable, equity performance is extremely good. In the graph above you can see two very good periods reflecting this:

  • (ORANGE): Earnings recovered very fast after the Global Financial Crisis of 2008 and also after the initial stages of the Covid pandemic.
  • (BLACK): FED rates tumbled to almost 0% after the Global Financial Crisis of 2008 and again during the Covid pandemic.
  • (BLUE). The SP500 performed extremely well when the two tail winds blew in the same direction: 16.5% CAGR during the 2009-13 period, and 30% CAGR since April 2020.

But the party cannot last forever, and Central Banks will start tightening and withdrawing liquidity once the economy recovers. The graph shows this situation during the period of Jun13 to Dec18 when the FED started tapering, and then hiking rates. This was an earnings driven market where profits continued to increase while liquidity was reduced by Central Banks. Still the equity market managed to achieve a respectable 9% CAGR performance.

Where are we now? Thanks to the combined efforts of the scientific world (vaccines), Central Banks (rate cuts + bond purchases) and Governments (huge fiscal packages) the world economy has recovered well, so the economy no longer needs assistance from Central Banks. They have either started to reduce liquidity (Bank of England, Norway…), or will do so during 2022 (FED, ECB, …)


WHAT CAN WE EXPECT FOR 2022?

  • (BLACK): The FED will gradually stop buying bonds by April 2022; during 2022 the FED rates will likely increase 3 times, by 0.25% each time. This will be a headwind for the market. Remember the old saying: “Don’t fight the FED”.
  • (ORANGE): Earnings have recovered very fast in 2021 and will continue to increase in 2022 and 2023, but at a lower rate of 10% according to IBES estimates, which is much less than the 25% increase that we enjoyed in 2021.
  • (BLUE). The SP500 will likely rise again in 2022 but with the headwinds from the Central Banks and the lower EPS growth, the market will probably shift down a gear to deliver a return of 5% to 10% performance during 2022.


Past performance is not indicative of future results. The views, strategies and financial instruments described in this document may not be suitable for all investors. Opinions expressed are current opinions as of date(s) appearing in this material only.

References to market or composite indices, benchmarks or other measures of relative market performance over a specified period of time are provided for your information only. NS Partners provides no warranty and makes no representation of any kind whatsoever regarding the accuracy and completeness of any data, including financial market data, quotes, research notes or other financial instrument referred to in this document.

This document does not constitute an offer or solicitation to any person in any jurisdiction in which such offer or solicitation is not authorized or to any person to whom it would be unlawful to make such offer or solicitation. Any reference in this document to specific securities and issuers are for illustrative purposes only, and should not be interpreted as recommendations to purchase or sell those securities. References in this document to investment funds that have not been registered with the FINMA cannot be distributed in or from Switzerland except to certain categories of eligible investors. Some of the entities of the NS Partners Group or its clients may hold a position in the financial instruments of any issuer discussed herein, or act as advisor to any such issuer.

 Additional information is available on request.

© NS Partners Group
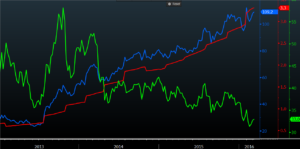
Chart of the Month – Shifting gears in the equity markets

Shifting gears in the equity markets

Source: Bloomberg, IBES, NS Partners

The two main drivers of equity markets are liquidity (provided by the Central Banks) and earnings (provided by corporations). When both drivers are favourable, equity performance is extremely good. In the graph above you can see two very good periods reflecting this:

  • (ORANGE): Earnings recovered very fast after the Great Recession of 2008 and also after the initial stages of the Covid pandemic.
  • (BLACK): FED rates tumbled to almost 0% after the Great Recession of 2008 and again during the Covid pandemic.
  • (BLUE). The SP500 performed extremely well when the two tail winds blew in the same direction: 16.5% CAGR during the 2009-13 period, and 30% CAGR since April 2020.

But the party cannot last forever, and Central Banks will start tightening and withdrawing liquidity once the economy recovers. The graph shows this situation during the period of Jun13 to Dec18 when the FED started tapering, and then hiking rates. This was an earnings driven market where profits continued to increase while liquidity was reduced by Central anks. Still the equity market managed to achieve a respectable 9% CAGR performance.

Where are we now? Thanks to the combined efforts of the scientific world (vaccines), Central Banks (rate cuts + bond purchases) and Governments (huge fiscal packages) the world economy has recovered well, so the economy no longer needs assistance from Central Banks. They have either started to reduce liquidity (Bank of England, Norway…), or will do so during 2022 (FED, ECB, …)


WHAT CAN WE EXPECT FOR 2022?

  • (BLACK): The FED will gradually stop buying bonds by April 2022; during 2022 the FED rates will likely increase 3 times, by 0.25% each time. This will be a headwind for the market. Remember the old saying: “Don’t fight the FED”.
  • (ORANGE): Earnings have recovered very fast in 2021 and will continue to increase in 2022 and 2023, but at a lower rate of 10% according to IBES estimates, which is much less than the 25% increase that we enjoyed in 2021.
  • (BLUE). The SP500 will likely rise again in 2022 but with the headwinds from the Central Banks and the lower EPS growth, the market will probably shift down a gear to deliver a return of 5% to 10% performance during 2022.


Past performance is not indicative of future results. The views, strategies and financial instruments described in this document may not be suitable for all investors. Opinions expressed are current opinions as of date(s) appearing in this material only.

References to market or composite indices, benchmarks or other measures of relative market performance over a specified period of time are provided for your information only. NS Partners provides no warranty and makes no representation of any kind whatsoever regarding the accuracy and completeness of any data, including financial market data, quotes, research notes or other financial instrument referred to in this document.

This document does not constitute an offer or solicitation to any person in any jurisdiction in which such offer or solicitation is not authorized or to any person to whom it would be unlawful to make such offer or solicitation. Any reference in this document to specific securities and issuers are for illustrative purposes only, and should not be interpreted as recommendations to purchase or sell those securities. References in this document to investment funds that have not been registered with the FINMA cannot be distributed in or from Switzerland except to certain categories of eligible investors. Some of the entities of the NS Partners Group or its clients may hold a position in the financial instruments of any issuer discussed herein, or act as advisor to any such issuer.

 Additional information is available on request.

© NS Partners Group

Chart of the Month – Shifting gears in the equity markets

Shifting gears in the equity markets

Source: Bloomberg, IBES, NS Partners

The two main drivers of equity markets are liquidity (provided by the Central Banks) and earnings (provided by corporations). When both drivers are favourable, equity performance is extremely good. In the graph above you can see two very good periods reflecting this:

  • (ORANGE): Earnings recovered very fast after the Great Recession of 2008 and also after the initial stages of the Covid pandemic.
  • (BLACK): FED rates tumbled to almost 0% after the Great Recession of 2008 and again during the Covid pandemic.
  • (BLUE). The SP500 performed extremely well when the two tail winds blew in the same direction: 16.5% CAGR during the 2009-13 period, and 30% CAGR since April 2020.

But the party cannot last forever, and Central Banks will start tightening and withdrawing liquidity once the economy recovers. The graph shows this situation during the period of Jun13 to Dec18 when the FED started tapering, and then hiking rates. This was an earnings driven market where profits continued to increase while liquidity was reduced by Central anks. Still the equity market managed to achieve a respectable 9% CAGR performance.

Where are we now? Thanks to the combined efforts of the scientific world (vaccines), Central Banks (rate cuts + bond purchases) and Governments (huge fiscal packages) the world economy has recovered well, so the economy no longer needs assistance from Central Banks. They have either started to reduce liquidity (Bank of England, Norway…), or will do so during 2022 (FED, ECB, …)


WHAT CAN WE EXPECT FOR 2022?

  • (BLACK): The FED will gradually stop buying bonds by April 2022; during 2022 the FED rates will likely increase 3 times, by 0.25% each time. This will be a headwind for the market. Remember the old saying: “Don’t fight the FED”.
  • (ORANGE): Earnings have recovered very fast in 2021 and will continue to increase in 2022 and 2023, but at a lower rate of 10% according to IBES estimates, which is much less than the 25% increase that we enjoyed in 2021.
  • (BLUE). The SP500 will likely rise again in 2022 but with the headwinds from the Central Banks and the lower EPS growth, the market will probably shift down a gear to deliver a return of 5% to 10% performance during 2022.


Past performance is not indicative of future results. The views, strategies and financial instruments described in this document may not be suitable for all investors. Opinions expressed are current opinions as of date(s) appearing in this material only.

References to market or composite indices, benchmarks or other measures of relative market performance over a specified period of time are provided for your information only. NS Partners provides no warranty and makes no representation of any kind whatsoever regarding the accuracy and completeness of any data, including financial market data, quotes, research notes or other financial instrument referred to in this document.

This document does not constitute an offer or solicitation to any person in any jurisdiction in which such offer or solicitation is not authorized or to any person to whom it would be unlawful to make such offer or solicitation. Any reference in this document to specific securities and issuers are for illustrative purposes only, and should not be interpreted as recommendations to purchase or sell those securities. References in this document to investment funds that have not been registered with the FINMA cannot be distributed in or from Switzerland except to certain categories of eligible investors. Some of the entities of the NS Partners Group or its clients may hold a position in the financial instruments of any issuer discussed herein, or act as advisor to any such issuer.

 Additional information is available on request.

© NS Partners Group

Chart of the month: March Edition

What is cheap? what is expensive? Choose your camp!

How to choose stocks
Company 1. Red line: trailing 12 month Earnings per Share, Green line: Price Earnings Ratio, Blue line: share price


How to choose stocks
Company 2. Red line: trailing 12 month Earnings per Share, Green line: Price Earnings Ratio, Blue line: share price


So you have here two charts showing the evolution over more than 3 years of earnings, PE multiple and price for two distinct companies. One is supposedly a safe haven stock (company 1), paying a good dividend, on which losing money seems almost impossible whereas the other one (company 2) is that kind of “hype” stocks which, at some point should fall off a cliff because of overvaluation.

An equity investor must first and foremost look at the stream of earnings a company can generate in order to decide whether to buy this or that stock. Dividends are important, but come after earnings because when a corporation generates profit and does not pay a dividend, this profit goes straight up into shareholder equity, which means that in theory profits paid in dividends or retained into the company’s balance sheet should not impact the attractiveness of a listed stock.


We have seen an incredible and almost unprecedented appetite during the last 3 to 5 years for quality stocks, with predictable earnings and reasonable dividends. This seems quite logical in an unstable environment. Investors are skeptical about the economic cycle, about the financial system, about capital expenditure, and so on, therefore buying into blue chips, generally in the consumer staples sector, tends to be the only acceptable investment. And in most cases, they were right! Those large caps (Nestlé, P&G, Colgate, Unilever, Coca-Cola and others) have performed honorably, paid dividends, and were quite resilient when markets were nervous.


In the first chart, you can see a company which has seen its share price go from 60 to 71, its PE multiple climb from 16.5x to 20.8x, and its EPS slip from 3.65 to 3.4.

In the second chart, share price soars from 40 to 109, but EPS explodes from 0.75 to 3.3…. so mechanically the PE multiple falls from 48 to 33.


In our view, the first company does not deserve such a valuation and favorable performance if one takes out the extraordinary fall in interest rates which has magnified the stable nature of its business. There should be no other explanation because in a “normal” environment, a corporation which sees its earnings headed down should not see its share price and PE climb.

What about the second company? It was expensive when it traded at 48 times earnings, but over the considered period earnings have been multiplied by 4.4 while share price “only” rose 2.7 times. It still trades at 33 times earnings but will soon get cheaper than company 1 thanks to EPS growth.


Which one would you buy today? Indeed interest rates could still fall further and help company 1’s valuation remain at current levels (or higher), but it seems difficult to imagine that the stock can trade at a substantially higher PE as long as earnings don’t grow. We largely prefer company 2 because, as said before, the stream of earnings plays in favor of the investor. At the end of the day, the winners in equity markets are those who increase earnings, not those who benefit from external forces to drive their multiple on the upside.


By the way, company 1 is Nestlé. Company 2 is Facebook.