Chart of the Month – Time to invest in European banks equities

Time to invest in European banks equities
Source: Bloomberg, IBES

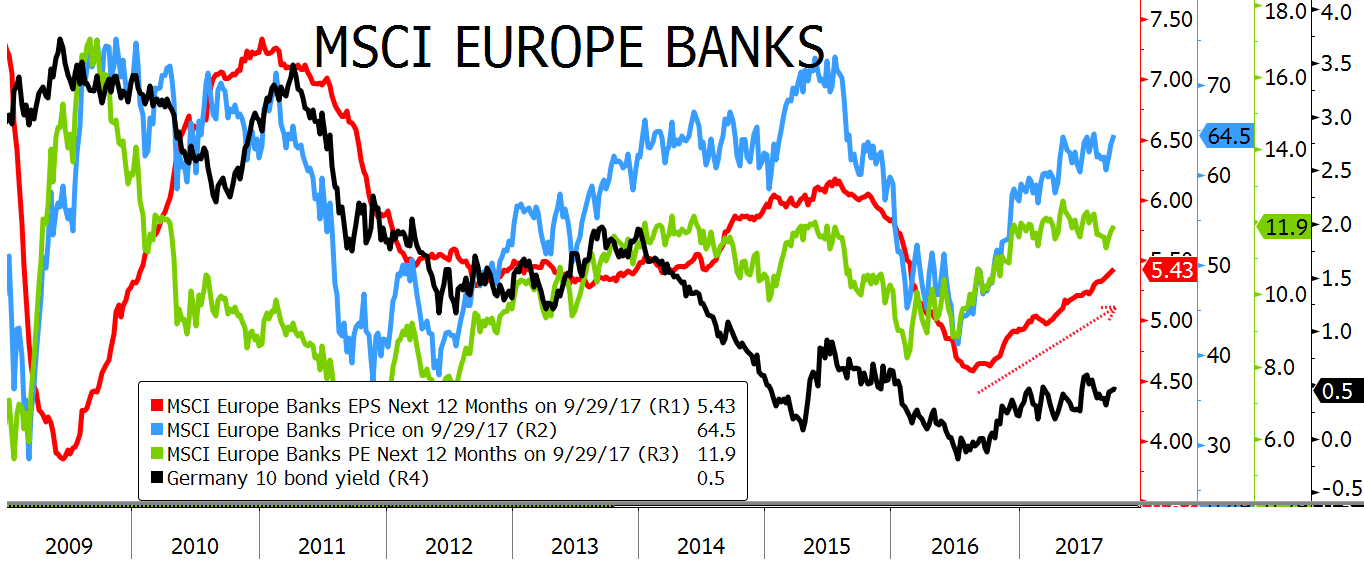
Banks have been underperforming dramatically since the burst of the bubbles in 2008, especially in the European market, but since the middle of 2016 the trend has been reversed. The graph shows the following information:

  • Blue line: Price evolution. Minimum was touched in July-2016
  • Red line: Earnings Per Share expectations (IBES) for the next 12 months. After a long period where profits were consistently going down, in August-2016, expected profits improved 20% until today.
  • Black line: 10 year German bond rate. Rates were negative (-0.2%) in July16 and since then the yield has increased to 0.5% today.
  • Green line: Price/Earnings (PE) ratio for the next 12 months. In January, PE was 8.2x (40% discount to the whole European equity market) and today we have reached 11.9x (20% discount to the European equity market). In relative terms, this valuation is in line with the one of the last 10 years. The sector trades at a discount to the total market due to the perceived higher risk.

WHAT HAS HAPPENED TO EXPLAIN THE RECENT RERATING?

Many planets aligned during the last 15 months:

  1. The economy has been growing at 2%.
  2. Banks have decreased their provisions for Non Performing Loans.
  3. Banks have increased their loan activity to both household and non-financial corporations.
  4. Financial costs have decreased after the huge monetary stimuli of the ECB.
  5. Net Interest Margin have started to increase.
  6. Weak banks have finally raised enough capital (Deutsche Bank, Unicredit, etc.) or have been sold out (Popular, small Italian banks, etc). Now, the Core Capital (CET1) of the European banks is twice as much as what it was in 2007.

…AND, MORE IMPORTANT, WHAT CAN BE EXPECTED IN THE NEAR FUTURE?

All the factors described above are still in place to help the banks. Furthermore, in 2018 it is expected that the ECB will start unwinding some of the extraordinary measures they put in place to stimulate the economic expansion. Somehow, this unwinding process will cause interest rates to “normalize”, namely to go higher. In that scenario, the Net Interest Margin of the banks will improve, whereas NPL provisions will decrease and contribute positively to the bottom line.
We would expect the red line (EPS) to continue the uptrend, and probably a PE rerating also. The combination of these two factors will make the European banking sector more attractive than the overall equity market. Both trends will even be more positive in the Eurozone banks.
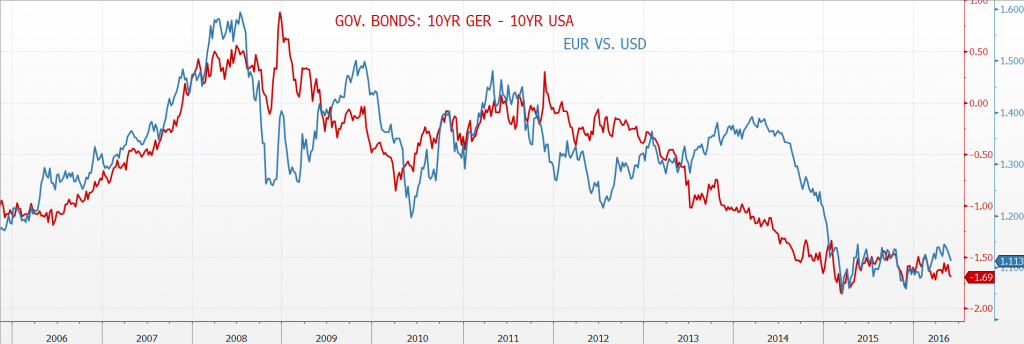
Chart of the month – Euro Dollar parity: the logical song

Chart of the month

EURO DOLLAR PARITY: THE LOGICAL SONG

Source: Bloomberg
Source: Bloomberg

This recurrent question which always comes from the audience when a financial presentation is held (outside of the US of course): “and, what do you think of the dollar?”…… and it very often embarrasses the speakers because you normally can illustrate a bearish or a bullish scenario with numerous different reasons:

  • Commodities are down, so the dollar goes up
  • Risk-off environment, the dollar falls
  • Foreign Central Banks build up their USD reserves, so the Greenback rises
  • Sovereign Wealth Funds liquidate positions, the dollar is headed down
  • Forget about any short term move, the dollar is the reserve currency of the world and, as such, must fall
  • US corporates hold trillions of dollars offshore and will repatriate them…the dollar will rise…

This non-exhaustive list just show how easy it is to find a rationale for supporting a bearish or a bullish view on the dollar, and there are probably times when one or two or all these explanations are perfectly valid…. But what about a simple, verifiable and proven reason like….interest rates differential?

Yes, this sounds logical, and can be checked over a long period of time as the chart above shows when it comes to find a trustful cause for the euro-dollar parity movements: the interest rates differential between the US 10 year Treasury and the German 10 year Bund seem to be a good proxy for explaining the long term trend for the EUR/USD. To make it simple, when the red line falls the gap between the yield of a US 10 year Treasury and the 10 year Bund widens, so you are better remunerated for holding dollars than euros, and conversely when the red line rises. And the blue line is the euro-dollar parity.

Furthermore this comparison offers you nice positioning opportunities if you have a long term view. Just to illustrate, look at the wonderful recurrent buying opportunities you had on the dollar versus the euro from mid-2013 until mid-2014. The euro was on the rise while the interest rates differential was telling you that the opposite should have occurred.

So today what should be the answer when this terrible question arises: “and, what do you think of the dollar?”? The easiest answer is that the dollar is supported by a better remuneration, not by a wide margin though, but the speeches from the ECB and the Fed tell us that this yield differential should last for a while, so holding some dollars in a euro account makes sense today.