Chart of the Month – Emerging markets’ affinity for luxury: a growing trend

Chart of the Month – Emerging markets’ affinity for luxury: a growing trend

Are you currently considering investment opportunities in emerging markets, all while maintaining a strong presence in assets listed on both European and American markets?

Luxury might just be the ideal solution.

While the luxury sector began the year on a strong note, it has faced challenges in the past two months. Luxury equities saw a decline in August and September, attributed to various factors such as increasing interest rates, disappointing economic data from China including renewed concerns about the real estate market potentially affecting consumer demand and shifts in analyst recommendations. These elements have introduced uncertainty regarding these growth assets.

Nevertheless, the financial results reported during the first half of the year provide an encouraging outlook and underline the resilience of this thematic investment. Many of the leading luxury groups are predominantly listed on European and American markets. However, it is essential to assess the extent to which their revenue is derived from emerging markets. A global estimate is therefore essential.

When focusing on the most prominent and distinguished luxury brands, such as LVMH, Hermès, Kering, Moncler, and Burberry in the realm of soft luxury category, Estée Lauder and L’Oréal in the beauty and cosmetics, Compagnie Financière Richemont for hard luxury, Diageo and Pernod Ricard for spirits, and Porsche and Ferrari for automobiles, it becomes evident that the Asia-Pacific region, predominantly represented by China, plays a significant role. This region accounts for over 25% of first-half 2023 revenue. Notably, Hermès leads the pack with a substantial 49% contribution, followed closely by Burberry and Moncler at 44%. Similarly, for Compagnie Financière Richemont and Pernod Ricard the dynamic market contributes 41%. Should we broaden our perspective to encompass other emerging regions, such as for example Latin America and Africa, we find that major luxury groups maintain exposure levels exceeding 35% to emerging countries.

Why are emerging countries catalysts? The luxury sector is buoyed by consumption, increasingly driven by the expanding middle class. Emerging countries are experiencing notable economic growth, with China leading the way and poised to maintain its position at the forefront. Asian consumers aspire to showcase symbols of success and embrace cosmopolitan lifestyles. This year, however, China experienced a slowdown in growth, recovering more slowly than expected. Nevertheless, by 2030, it is predicted that the Chinese, in their own country, will be the largest consumers of luxury goods, according to the renowned firm Bain and Company.

Another rapidly growing economy making headlines is India which is re-entering the global economic spotlight on several fronts. Although luxury consumption in India is currently relatively low, it is showing substantial growth, with a remarkable 26% year-over-year increase. Millennials are the driving force behind the flourishing luxury industry, as India boasts the largest share of millennial consumers among major international economies, exceeding 30%. This demographic profile, combined with rapidly rising urban household incomes, is fueling the swift growth of luxury consumption in India. The Indian economy appears to be on a robust growth trajectory, with one of the fastest GDP growth rates among major world economies.

Investing in emerging markets through well-established and well-managed European and American companies is a prudent strategy. The luxury sector has demonstrated resilience and is considered an all-weather investment. In many cases, the Price/Earnings ratio (P/E) for these companies has returned to pre-COVID levels. Historically, buying luxury company stocks during market corrections has proven to be a profitable investment strategy.


Past performance is not indicative of future results. The views, strategies and financial instruments described in this document may not be suitable for all investors. Opinions expressed are current opinions as of date(s) appearing in this material only. References to market or composite indices, benchmarks or other measures of relative market performance over a specified period of time are provided for your information only. NS Partners provides no warranty and makes no representation of any kind whatsoever regarding the accuracy and completeness of any data, including financial market data, quotes, research notes or other financial instrument referred to in this document. This document does not constitute an offer or solicitation to any person in any jurisdiction in which such offer or solicitation is not authorized or to any person to whom it would be unlawful to make such offer or solicitation. Any reference in this document to specific securities and issuers are for illustrative purposes only, and should not be interpreted as recommendations to purchase or sell those securities. References in this document to investment funds that have not been registered with the FINMA cannot be distributed in or from Switzerland except to certain categories of eligible investors. Some of the entities of the NS Partners Group or its clients may hold a position in the financial instruments of any issuer discussed herein, or act as advisor to any such issuer.  Additional information is available on request.
© NS Partners Group

Notes on Investment Policy Conference 10 January 2023

Notes on Investment Policy Conference 10 January 2023.

Presentation by Louis Gave of Gavekal

2022 was an unusual year. For the first time in decades OECD bonds became positively correlated to equities, and both fell dramatically. However, there were signs that markets were beginning to move in a different direction to that of the last decade. Technology stocks had a poor year and there is little sign that this will reverse. Meanwhile Emerging Market bonds and equities outperformed their Developed Market equivalents. This was particularly noteworthy given the strengths of the US dollar and the China lockdown. The one sector to perform well was energy, and with Russia’s invasion of Ukraine energy is likely to continue to dominate headlines. Gold also started to perform better after a long period of drift, and this may be signalling the end of the dollar’s supremacy.

In 2023 China’s reopening of its economy after three years of strict lockdown will be the most important macro event of the year. China’s stock market has suffered a 40% decline relative to the World Index since 2012, and even more against the rampaging US markets. But the outlook is much better. The Chinese market has started to recover, pushed by the Chinese retail investor. Chinese households have the most cash in the bank ever because of their inability to spend during the last three years. This cash hoard is estimated at RMB14.8 trillion. There is massive pent up demand and mortgage and auto loan rates are low, which will stimulate consumption as the Chinese population is released. Following years of poor performance foreign investors have given up on China, so the marginal seller that has accounted for recent underperformance has disappeared.

The reopening of China is inflationary. It is likely that the same pattern will occur in China as took place in the West following their re-openings. That is there will be labour shortages as the return to work is interrupted by waves of Covid. Companies, particularly manufacturing ones, will need to overstaff to cover sick leave absences. This will make labour markets very tight, and lead to periodic supply issues. China’s recovery will also be positive for energy demand. Energy supply is already tight and demand will rise with the recovery. There has been a geopolitical shift as Russian oil has been redirected to China, away from the West. The blowing up of the Nordstream pipeline has forced Russia to turn East. China will enjoy an advantage as it is able to buy oil at a discount to world prices. This applies to all commodities and because Russia is the world’s largest commodity exporter and China the world’s largest commodity importer, the fact that they are dealing off market will make pricing opaque and commodity prices will probably be more volatile.

The message for world markets at the start of 2023 is that everything from China looks inflationary. China’s poor handling of Covid means that it has to make a success of its reopening. This will lead to higher commodity prices, higher wage growth, and more demand. This view is in contrast to the general view that inflation will come under control during 2023. The long period of disinflation looks to be over, and we are entering an era of inflation. This has significant implications for portfolios. Most portfolios are set for disinflation – they are full of bonds and technology stocks. In an inflationary world bonds don’t offer protection. Portfolios need to adapt to reflect the new world. The outperformance of Emerging Markets, commodities and financials point to the new areas of leadership.

2022 looks like an inflection point. The winners of the last decade look tired. The Chinese reopening should spur an outperformance of Emerging Markets over Western ones. The US market looks expensive relative to both Emerging Markets, Japan and Europe. There are also signs that the US dollar may be rolling over. Over a longer view investors should be looking to position themselves to benefit from the decarbonisation theme, the recovery of financial stocks and outperformance by precious metals. The areas to be more cautious include the US dollar, bonds, and bond proxies such as real estate and large cap growth stocks.

Download PDF

Protected: NS Investment Conference, 28 June 2022

This content is password-protected. To view it, please enter the password below.

Chart of the Month – Nifty – But not fifty

Chart of the month: Nifty – But not fifty

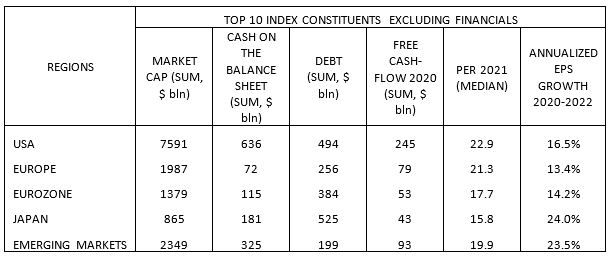
In this strange and hectic year for markets, giving ammunition to both bulls and bears, eyeballing the top ten constituents of major equity indices gives an indication of what can be expected, and at what cost, for the coming months: in the table below, we highlight different metrics for the US, Europe, the Eurozone, Japan and Emerging Markets.

First of all, what is striking in this table is the size and the quality characteristics of the US market: its largest companies’ market caps exceed the sum of all the others. The cash on their balance sheets and their free cash-flow generation almost match the sum of all the others, and their debt load is by far lower than the sum of all the others. This comes at a price, as their median PER exceeds the others as well.
Another remarkable fact is that Emerging Markets largest companies tend, for the majority of them, to also fall into the “Quality” side of equities, thanks to the IT heavyweights which did not show up some years ago (Alibaba, Tencent, TSMC, JD.com, just to cite a few). Thanks to this, the top constituents of EM share with their US counterparts some interesting features: cash exceeds debt, and just two years of free cash-flow suffice to pay down the entire debt burden. What a contrast with the Eurozone or Japan! And the reason for that is simple: there are still four “Value” or “Cyclical” companies in this top ten in the Eurozone (Total, Siemens, Bayer and Enel), and two in Japan (Toyota and Honda). The lower valuation of these markets seems justified.
And finally, if it is met, the median annualized EPS growth for the next two years looks appealing for all regions. Although it compares favorably for Japan, especially in relation to valuation, this must be relativized by the fact that there are two car manufacturers distorting the numbers here.
With these metrics, large caps equities don’t seem overvalued in general, whatever the region. On top of that, there are probably less risks of missed earnings expectations with the current large weighting in non-cyclical sectors, notably in the US and in Emerging Markets, and an optimistic investor can even hope for a stronger than expected economic rebound that would favor markets like Japan or the Eurozone. The US mega caps seem to be the less prone to bad surprises considering their solid balance sheets and high cash generation, which probably explains their higher valuation. But still, today’s valuations of highly popular stocks in the US are by no means comparable to the nifty fifty bubble, in particular when taking their growth prospects into consideration.
A blended and global approach in terms of stock-picking appears to be the best strategy when it comes to large cap investing going forward, with reasonable probabilities of generating pleasant risk-adjusted returns, especially when compared with other asset classes. Despite all the headwinds, the common wisdom that good things happen to good and well managed companies still prevails.


Past performance is not indicative of future results. The views, strategies and financial instruments described in this document may not be suitable for all investors. Opinions expressed are current opinions as of date(s) appearing in this material only.

References to market or composite indices, benchmarks or other measures of relative market performance over a specified period of time are provided for your information only. Notz, Stucki provides no warranty and makes no representation of any kind whatsoever regarding the accuracy and completeness of any data, including financial market data, quotes, research notes or other financial instrument referred to in this document.

This document does not constitute an offer or solicitation to any person in any jurisdiction in which such offer or solicitation is not authorized or to any person to whom it would be unlawful to make such offer or solicitation. Any reference in this document to specific securities and issuers are for illustrative purposes only, and should not be interpreted as recommendations to purchase or sell those securities. References in this document to investment funds that have not been registered with the FINMA cannot be distributed in or from Switzerland except to certain categories of eligible investors. Some of the entities of the Notz Stucki Group or its clients may hold a position in the financial instruments of any issuer discussed herein, or act as advisor to any such issuer.

 Additional information is available on request.

© Notz Stucki Group

Chart of the Month – Credit Dislocation

Credit Dislocation

Source: Bloomberg

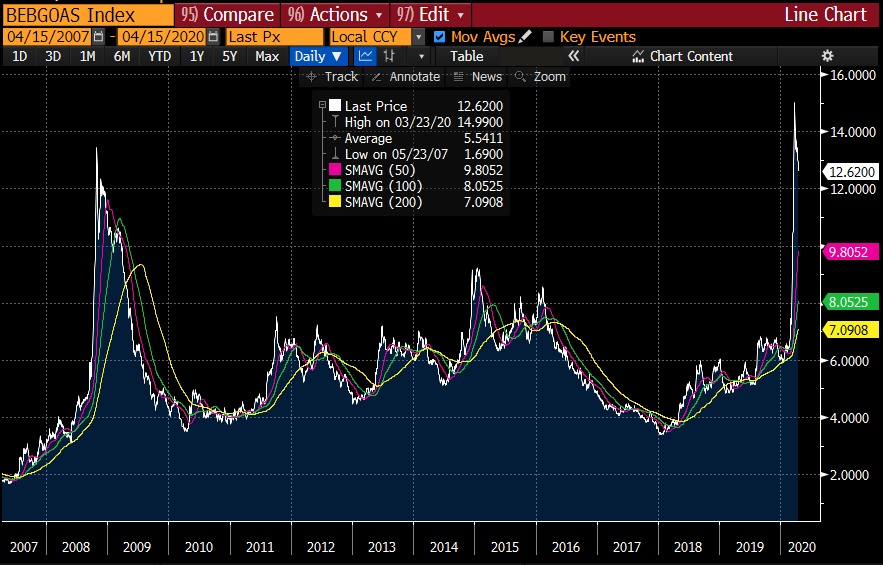
The COVID-19 crisis has translated into one of the biggest financial markets shock in history. The spread in Emerging Market High Yield Debt widened more than during the global financial crisis in 2008. Importantly, this widening happened in a matter of few weeks. This shock is also visible in most asset classes across financial markets. There were essentially two catalysts that explained this crash.

First, the pandemic obliged most countries to suddenly shut down, creating a deep recession without the usual slowdown process which could have allowed to anticipate it. The COVID-19 crisis was also amplified by the price war in Oil, affecting many Emerging markets countries and making the situation even worse. The market suddenly started to price a sharp increase of corporate or sovereign defaults over the coming months.

Second, as market participants realised how deep the problem is, there was a rush to exit risk exposure and de-leverage. However, no one or very few market participants were in a position to absorb this risk, including market makers at global investment banks. Indeed, global investment banks were obliged to deleverage their balance sheets and many global regulations prevent them to be the liquidity provider they use to be. As a result, liquidity disappeared in a matter of days. The Fed decided to intervene massively in order to stabilise markets and regulators are now giving slightly more margin of manoeuvre to banks in order to improve market liquidity.

Dislocations create opportunities but it might be ambitious at this stage to anticipate a V shape recovery without a treatment or a vaccine that allow consumers to resume their pre-crisis way of life.

Chart of the Month – FED vs Growth for Emerging Markets

FED vs Growth for Emerging Markets

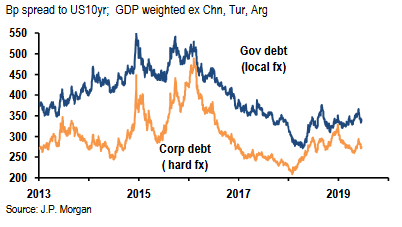
We are generally not fan of discussing EM as a single group as countries’ profiles and reaction functions are increasingly different from a country to another. But for the sake of simplification in this monthly chart we would assume so.

So which EM asset class would benefit most in the context of renewed global monetary easing? That would not only depend on short-term rates at the FED and the ECB. For EM currencies, as the FED move dovish, all major EM central banks are also expected to cut their policy rates. While the possible FED resumption of an easing cycle has recently pushed most EM currencies higher, the next leg up might take some time to materialise. The market might now wait for actual cut to materialise and growth to improve (including some sort of trade tensions resolution or truce between the US and China). The other ingredient needed to support EM currencies and local debt more generally, is inflation which in both the US and EM (collectively or individually) should stay contained.

For EM credit, a mild or even sluggish growth would be enough for the asset class to keep performing in the context of dovish central banks and contained inflation.

The real underperformer so far is EM equity and more specifically Asia Equity complex. In the case of EM equity, a higher inflation would be much better absorbed if growth rebounds and trade conflict is contained or resolved.

Notz Stucki Investment Meeting – Pierre Gave

Is the worst of the global slowdown behind us?

In 2018 there was no place to hide in financial markets, but in the first quarter of this year a much better environment took hold. The turnaround is surprising in some ways. The fundamentals of most economies have not changed much. Growth has been slowing everywhere, but this was not unexpected. Given the length of the expansion, now a record 37 quarters in the US, a slowdown was inevitable. But for financial markets liquidity was the critical factor. After 10 years of central banks adding liquidity to the system, this reversed last year led by the US and China. Markets foundered, but when the Fed made a complete reversal of policy in January, and China announced a new stimulus package, the market rallied hard. The market reaction suggests they have repriced growth, but that growth has not come through yet. If there is one message that investors should take away it is that when the world’s monetary base contracts trouble follows.

While liquidity conditions remain benign it will still require fundamentals to do well for asset prices to rise from here. The outlook for the US economy is still positive, but the growth is more moderate than before. Two areas look likely to do well are the consumer and housing. Mortgage activity and construction should pick up, as affordability is good. A further positive is inflation is not a problem. There is some wage inflation, but it is modest. Globalisation and automation/robotics remain powerful forces on labour’s ability to bargain. A boost to the stock market could come from the dollar falling. On a PPP basis the dollar is expensive, but it enjoys a yield premium and the relative strength of the US economy. The principal concern in the US is debt. The US government deficit is projected to reach $1.4 trillion this year. Corporate debt has ballooned and much of it has been deployed in financial engineering, not invested in productive assets. For example in Q4 2018 there was a record $225 billion of share buy backs. But total US leverage is not so bad because household leverage has declined.

Europe is much more vulnerable to world trade and global growth declining. If President Trump introduces tariffs on the auto sector this would be significant. For Germany in particular the auto sector is an important part of the economy. Car production already faces a weak environment as it is in the middle of a big technological shift, and sales  in China slow as capacity has been reached, and demand there now enters a replacement cycle phase. Europe’s domestic demand remains sluggish, and this is being worsened by the recent rise in oil prices. The ECB are at the limits of what they can do with monetary policy. In theory Europe should undertake a fiscal stimulus, but it is constrained by fiscal rules on this. Indeed the German Finance minister has just said that weak growth limits the ability to make fiscal packages. If Germany slips into recession then this thinking may start to change. To reinvigorate Europe probably requires massive fiscal stimulus by a tax cut and infrastructure packages. For now there is little appetite for this.

China has also slowed, but it should pick up in the second half. China’s slowdown is different from its previous ones which centred on its industrial economy. This time the slow down relates more to the consumer credit. The export numbers have also fallen, but this may be due to buyers building inventory ahead of US tariff imposition. Nonetheless China is ramping up stimulus and the results should be seen in the second half. It will mean that leverage will rise again in China, which may become a problem in the future, but is not a concern for now. A recovery in China will help the emerging markets where investors are massively underweight, but they are unlikely to rebalance until the dollar weakens.

There is a calmer mood in the market compared to the end of last year. It has been created by the Fed stepping back from raising rates, China’s stimulus, and a brighter outlook on the US-China trade talks. Against that must be weighed the fact that global growth is slowing, Europe is on the brink of recession and US government borrowing is far too high for this stage of the cycle. A big unknown swing factor is the oil price which has been rising recently. If this continues it could upset the better sentiment. But the combination of the world’s two major economies looking set for steady growth this year, and no sign of inflation, provides a good background for equities.

Please click here to download the investment policy notes.

Chart of the Month – Emerging Markets FX Feels Woes From Trade

Emerging Markets FX Feels Woes From Trade

Source: CPB Netherlands Bureau for Economic Policy Analysis; Goldman Sachs; JP Morgan; Notz Stucki

The FED and the ECB have both recently turned more dovish, US 10Y yield is lower compared to the beginning of the year and is also well off its 2018 peak, China is expected to stabilise growth thanks to recently announced fiscal and monetary stimulus measures and credit spread have compressed aggressively year to date. Market expects that current trade negotiations between the US and China could at least deliver a short-term truce and potentially less tariffs.

All these factors should have been very supportive to Emerging Market (EM) currencies. So why are they lagging other asset classes in 2019 so far?

One of the reasons that could explain this underperformance is the fact that EM central banks have themselves turned dovish after the FED announced the end of Quantitative tightening. Central Banks of Brazil, Mexico, Indonesia, India, Chile, etc… have all either turned dovish or reduced their tightening bias. The only exception is central bank of Turkey which is maintaining discipline to regain credibility but even there it hasn’t paid off as the Turkish Lira performance is negative year to date.

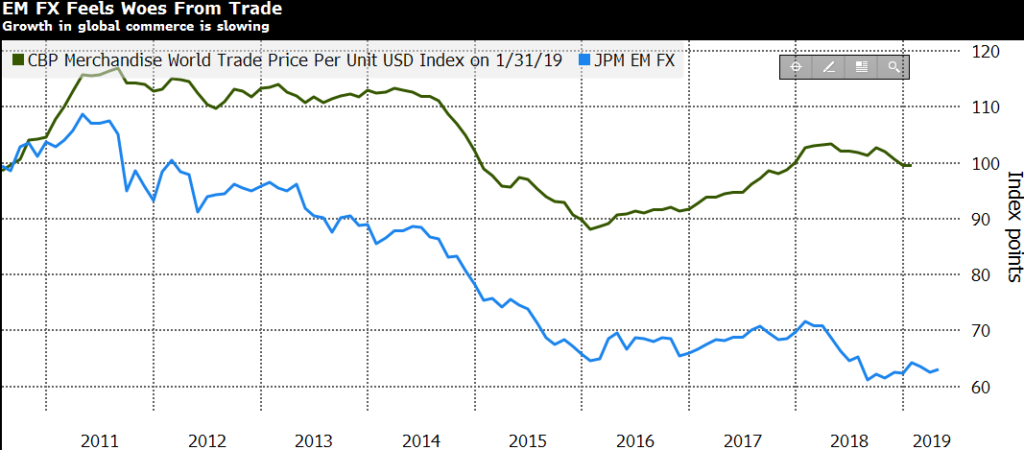
Others possible reasons are not encouraging. As we see in our chart of the month above, there is a long-term correlation between global trade growth and the performance of EM currencies. It could be that EM currencies are telling us that we are in a persistent trend of lower trade or lower trade growth and a short-term deal between the US and China would not be a long-term game changer. EM needs a proper and long-term resolution of trade dispute which clear the outlook for global trade to resume growth.

Investment Review Q3 2018

“I think Trump may be one of those figures who appear in history from time to time to mark the end of an era and to force it to give up the old pretences.”

Henry Kissinger. 21.7.18

The third quarter was difficult in financial markets. Tightening liquidity as a result of the Federal Reserve’s increase in interest rates, escalating trade tensions, a rising oil price, and heightened worries on European stability with Brexit talks in a quagmire and a threat of Italy exiting the EU, all combined to undermine sentiment. However once again markets outside the US suffered most and by the end of the quarter the US equity market was at/near its highs. The US stock market is benefiting from a strong economy and the tax cuts that the Trump Administration achieved at the end of 2017. Goldman’s have estimated that share buybacks could reach almost one trillion dollars this year. This performance has been despite the rise in interest rates and bond yields as the ten-year rate rose to 3.05%. Outside the US surplus liquidity has been drained from the system exposing the weakest links, Argentina and Turkey’s currencies crashed and other Emerging Market assets suffered. This sharp divergence has been a feature of the last ten years. On the tenth anniversary of Lehman’s collapse and the ensuing financial crisis the surprise has been that while the US has had a weak economic recovery it was accompanied by a soaring stock market. The comparison to the Japanese experience following their collapse in 1990 could not be starker. Ten years after the Japanese bubble burst the Japanese Topix index was half its pre-crash level, while the S&P is up more than twice, and more than four times off its lows. Their bubbles were different, but a significant driver of the S&P’s recovery was the enormous share buybacks American companies have undertaken which Goldman Sachs estimates at $4.5 trillion over the last decade. This buyback program has been turbo charged by the Trump tax cuts with estimates that they will approach $1.5 trillion in 2018 alone.

Please click here to download the entire document.


Investment Outlook Q3 2018

At 10 times revenues, to give you a 10-year payback, I have to pay you 100% of revenues for 10 straight years in dividends. That assumes I can get that by my shareholders. That assumes I have zero cost of goods sold, which is very hard for a computer company. That assumes zero expenses, which is really hard for a company with 39,000 employees. That assumes I pay no taxes, which is very hard. And that assumes that you pay no taxes on your dividends, which is kind of illegal. And that assumes with zero R&D for the next 10 years I can maintain my current revenue rate….what were you thinking.

Scott McNealy, CEO of Sun Microsystems at the time of the dotcom crash when the shares were selling at 10 times sales.

Scott McNealy

At mid-year world bond and equity markets have struggled, with bonds delivering a slightly negative return and equities fell 1.3% as measured by the MSCI World Index, a poor return given that S&P earnings are estimated to increase by 25% this year (largely thanks to the tax cut at the end of 2017). Emerging Markets have been particularly poor performers. The reason is that liquidity has been tightening. In the US, quantitative easing is being steadily drained from the system at a rate of $30 billion a month, which rises to $40 billion from July 1st, and then $50 billion on October 1st. The oil price has risen about 30% over the past year, which results in a severe drain of liquidity. Labour markets have also been tightening creating some wage pressure and with inflation measures trending higher, bond yields have risen. On top of all this investors have been unnerved by a number of political developments, most obviously the trade disputes as the Trump Administration has now specified particular areas against China and Europe, and in Europe an Italian political crisis has threatened the stability of the Eurozone. The US tax cuts achieved at the end of last year, are a clear positive for the stock market, representing a substantial infusion of cash to shareholders. However tightening liquidity, the threat of protectionism and inflation are unfriendly for markets, and constitute significant headwinds. Together they have made the outlook for financial assets much more murky than was the case a few months ago. All markets have been buoyed on an ocean of liquidity for the past few years, so as that is removed a major support to asset prices disappears.

It is unusual to have trade wars when activity is expanding; generally they are a reaction to weak economic activity.

Please click here to download the entire document.