When Energy Enters Its Internet Era – Highlights from SPHERE PODIUM event in Geneva

During the recent SPHERE PODIUM GENEVA event on May 13, 2025, Pierre Mouton shared a thought-provoking perspective on the future of energy investing in his talk: When Energy Enters Its Internet Era.

Drawing parallels between the digital revolution and today’s energy transition, he explored how the DGC Energy Fund identifies profitable, high-quality companies driving structural change, without falling into the trap of speculative trends.

Watch the video from Pierre Mouton’s talk and discover why active management and disciplined fundamentals are more relevant than ever in the clean energy space.


September General Market Comments

September General Market Comments

“Why did you do it” – Stretch, 1975.

Most markets participants must have had these words in mind after Fed’s Jerome Powell sounded way more hawkish in September than what the majority was expecting. “Why did you do it”, Jerome? It seems that whatever the pain inflicted, the Fed wants inflation to tame further; there are clear tensions in Energy prices, but we all know that this is volatile and can revert quickly, so perhaps it is more on the wage front that reasons have to be found: a wave of pay increases is currently happening in the US, which certainly worries the Central Bank when it comes to the inflation transmission mechanism. In any case, the result is eye-popping with the US 10 year yield up 46 bps in September (up 70 bps year to date), dragging along almost all fixed-income markets on the downside.

This type of negative and abrupt move in bonds triggers well-known consequences: equities tumble, Value outperforms Growth, Gold falls and the dollar rises. But it can’t be said that investors scurried to buttress their defensive or value equities in September, as the equity sell-off was quite widespread.

The MSCI World abandoned 4.5% last month, the S&P 500 4.9%, the Stoxx 600 1.7%, the MSCI Emerging Markets 2.8% and the Japanese Topix only lost 0.4% (but the Yen receded by 2.7%, and is down 14% year to date versus the dollar). Value did better than Growth (-3% versus -5.7%), the dollar rose 2.5% versus the euro, and Gold fell 4.7%. Oil recorded a spectacular 8.6% rise for the WTI, buoyed by steady demand and OPEC’s determination to maintain limited supply.

That’s it for this month’s Market Comments, stay tuned, markets never skip a beat.


Past performance is not indicative of future results. The views, strategies and financial instruments described in this document may not be suitable for all investors. Opinions expressed are current opinions as of date(s) appearing in this material only. References to market or composite indices, benchmarks or other measures of relative market performance over a specified period of time are provided for your information only. NS PARTNERS SA provides no warranty and makes no representation of any kind whatsoever regarding the accuracy and completeness of any data, including financial market data or other financial instruments referred to in this general comment. This document does not constitute an offer or solicitation to any person in any jurisdiction in which such offer or solicitation is not authorized or to any person to whom it would be unlawful to make such offer or solicitation. Any reference in this document to specific securities and issuers are for illustrative purposes only, and should not be interpreted as recommendations to purchase or sell those securities. References in this document to investment funds that have not been registered with the FINMA cannot be distributed in or from Switzerland except to certain categories of eligible investors. Some of the entities of the NS Partners Group or its clients may hold a position in the financial instruments of any issuer discussed herein, or act as advisor to any such issuer. Additional information is available on request. © NS Partners Group

Energy efficiency: a theme of the future

Energy efficiency: a theme of the future

“Follow the money” – this principle can work just as well for investments as it does in police investigations.

Healthy and sustained increases in equity prices are always boosted by major investment or spending cycles. As examples, think of the bull market in steel at the start of the twentieth century, mass marketing and consumption in the 1950s-60s, or the notorious dot-com era, which fuelled a remarkable rise on the equity markets before the bubble burst.

Just under ten years ago, notwithstanding the current turbulence, a new sequence of significant rises was set in motion on the major equity markets, this time driven mainly by digitisation  – as evidenced by the growth figures posted in recent years by the cloud businesses of the likes of Microsoft, Amazon or Alphabet. This investment cycle, which has been around for a while now, could continue for several more years, although probably with less spectacular growth rates.

We can also expect massive investments in two other areas. One area is security in general and more specifically the defence industry, where we have seen increased spending on armaments since the start of the war in Ukraine.

The other, much more broad-based area we want to talk about is energy efficiency and transition – a theme that will underpin the biggest investment cycle ever seen. Some ballpark figures give an idea of the scale: we estimate that carbon neutrality targets will require spending of at least USD 150 trillion by 2050, equivalent to more than 1.5x global GDP and close to 7x US GDP.

The chances of the funds being committed are very high for several reasons, such as:

  • The climate emergency, and with it the regulations and new obligations that individuals, companies and governments will have to respect.
  • Competition – as we are already seeing, companies are increasingly pointing up the sustainability and compliance of their goods and services in their marketing pitches, and may be awarded carbon ratings – which are likely to impact the less virtuous firms.
  • Productivity, since traditional energy resources will gradually become more expensive, making the benefits to companies of using “clean” energy increasingly significant, with the potential to boost margins.

The unique characteristic of this cycle around energy efficiency is the number of sectors it encompasses. While many people automatically think of producers of electric vehicles, solar panels and wind turbines, and “clean” utilities, the theme is so much more than that. It involves vast swathes of the equity markets and includes companies that will play an essential and integral role in the achievement of carbon neutrality targets. Paradoxically, mining firms are not considered to have environmental credentials, but the energy transition will considerably increase demand for many metals. Similarly, in terms of materials, the construction sector will have to use low-carbon products and insulation. In industry, there are vast numbers of companies active in transport and logistics, machinery manufacturing, continuous process control and optimising electricity consumption, to name just a few applications. And it’s also in the industrial sphere where most of the companies specialising in energy efficiency are operating, in sectors such as IT, semiconductors, computer-aided development software, etc.

It’s clear that building a high quality portfolio diversified by sector and region, while posting reasonable valuation multiples, is perfectly possible by investing in the energy efficiency and transition theme. Overall, the necessary conditions for long-term performance are already in place, and the considerable investments expected for the foreseeable future make for an even more compelling argument.


Past performance is not indicative of future results. The views, strategies and financial instruments described in this document may not be suitable for all investors. Opinions expressed are current opinions as of the date(s) appearing in this material only. References to market or composite indices, benchmarks or other measures of relative market performance over a specified period of time are provided for your information only. NS Partners provides no warranty and makes no representation of any kind whatsoever regarding the accuracy and completeness of any data, including financial market data, quotes, research notes or other financial instruments referred to in this document. This document does not constitute an offer or solicitation to any person in any jurisdiction in which such offer or solicitation is not authorized or to any person to whom it would be unlawful to make such offer or solicitation. Any reference in this document to specific securities and issuers are for illustrative purposes only, and should not be interpreted as recommendations to purchase or sell those securities. References in this document to investment funds that have not been registered with the Finma cannot be distributed in or from Switzerland except to certain categories of eligible investors. Some of the entities of the NS Partners group or its clients may hold a position in the financial instruments of any issuer discussed herein, or act as advisor to any such issuer. Additional information is available on request.

© NS Partners Group

Chart of the Month – Turbulence ahead… Buckle up!

Turbulence ahead… Buckle up!

us wages inflationOil, natural gas, commodities, electricity, grain prices have become part of our daily lives during 2022. Some of these prices have dropped significantly from the peaks in April and May; for instance, Brent price tumbled 25% from early June to today. Why are capital markets and central banks still very worried about inflation? Wages may be the answer.
When we analyze the cost component of most goods and services, wages and salaries are more important than commodity prices. If we look at the USA (Chart above) we can see that US Average hourly earnings are growing at 5.20% as of 31-August, and the Employment Cost Index is increasing at 5.1% as of 30-June. The higher wages are pushing inflation higher and corporate margins lower. Even worse, wage increases tend to be more sticky than other components of inflation, so once you have salaries growing at 5%, it takes a while to convince unions and employees to accept lower increases in their incomes.

Why are salaries growing so fast compared to history?

  • The first and most obvious reason is that workers want to, at least, maintain their income in real terms. With headline inflation running at 8.5% in the USA, even with the current wage increases, they are losing money in real terms. If the market consensus is right, this pressure will diminish during the next 12 months.
  • The second reason is that demand for workers is very high in the USA, with an economy that has been booming since the lockdowns are over. We can see in the chart that job openings are very high with many companies willing to engage more workers. With the economy slowing down, we are seeing less job openings in some markets, but they are still at very high levels. Let’s remember that with a current unemployment rate of 3.7%, technically the US is working at full capacity (Powell estimates that 4.0% is full employment).
  • The third reason is that supply of workers is relatively low. The labour market participation rate used to be at about 63.0% before the pandemic, and with the latest August data, this participation is at 62.4%. What does this mean? There are between 1.1 to 1.5 million people in the USA who have quit the labour market, creating a lack of supply, so companies are forced to increase wages to attract workers. Fear of Covid, generous social programs and people willing to retire are the reasons mentioned to explain this lower participation rate. This ratio has improved a bit but it will be necessary to go to the previous 63% to better control the salaries.

In summary, the evolution of wages is key to control inflation, to maintain interest rates lower and to maintain corporate margins at high levels. For the time being, the FED tightening will diminish the demand for workers but we need some improvement on the supply side to be able to come back to wages growing at 3%, which will be more consistent with the overall FED target of inflation at around 2%. Buckle-up for this ride!


Past performance is not indicative of future results. The views, strategies and financial instruments described in this document may not be suitable for all investors. Opinions expressed are current opinions as of date(s) appearing in this material only. References to market or composite indices, benchmarks or other measures of relative market performance over a specified period of time are provided for your information only. NS Partners provides no warranty and makes no representation of any kind whatsoever regarding the accuracy and completeness of any data, including financial market data, quotes, research notes or other financial instrument referred to in this document. This document does not constitute an offer or solicitation to any person in any jurisdiction in which such offer or solicitation is not authorized or to any person to whom it would be unlawful to make such offer or solicitation. Any reference in this document to specific securities and issuers are for illustrative purposes only, and should not be interpreted as recommendations to purchase or sell those securities. References in this document to investment funds that have not been registered with the FINMA cannot be distributed in or from Switzerland except to certain categories of eligible investors. Some of the entities of the NS Partners Group or its clients may hold a position in the financial instruments of any issuer discussed herein, or act as advisor to any such issuer.  Additional information is available on request.

© NS Partners Group

July General Market Comments

July General Market Comments

« Whose Side Are You On? » – Matt Bianco, 1984

Are you on the optimists’ or the pessimists’ side? Or rather on the side of those who have no idea?

So far, 2022 tends to plead in favour of the pessimists, but optimists could argue that July 2022 was the best month for the S&P 500 since November 2020 (when Pfizer-BioNTech announced they had a vaccine against Covid), and those who have no idea could point out that finally markets were roughly flat for June-July 2022, as June was a dreadful month.

There are many things to factor in, and all of them give arguments to one side or another: inflation is high, but expected to normalize, especially since Central Banks seem keen on tackling it rapidly; geopolitics are a mess with not only the conflict between Russia and Ukraine, but also the heightened tensions between the US and China regarding Taiwan; corporate and private debt does not seem to be a source of problems today, but Government debt across developed markets is immense; earnings reports have been surprisingly good so far, but they are expected to slow down significantly going forward; commodities do not move in sync, but there seems to be a growing threat from Russia about gas deliveries in Europe for this winter, triggering skyrocketing gas prices. With all this happening at the same time, it is not easy to choose your side and it’s not surprising to see numerous experts change their minds, depending on the most recent events.

Buoyed by convincing earnings releases and some more risk appetite, equity markets soared in July: the MSCI World gained +7.86%, the S&P 500 +9.11%, the Nasdaq +12.55%, the MSCI Europe +7.52% and the Topix +3.71%. The only detractor was Emerging Markets, down 0.69%. As nominal and real yields fell, Growth outperformed Value with a +11.51% return for the MSCI World Growth versus +4.44% for its Value counterpart.

In such a risk-prone month, Credit also rose (+3.06% for the Itraxx Crossover), and Government yields fell (-36 bps for the US 10 year, -52 bps for Germany); Gold and Oil receded by 2.29% and 6.75% respectively, and the Euro fell further against the dollar (-2.51%), weakened by the possible looming energy crisis in Europe and an unfavourable interest rate differential.

That’s it for this month’s Market Comments, stay tuned, markets never skip a beat.


Past performance is not indicative of future results. The views, strategies and financial instruments described in this document may not be suitable for all investors. Opinions expressed are current opinions as of date(s) appearing in this material only. References to market or composite indices, benchmarks or other measures of relative market performance over a specified period of time are provided for your information only. NS PARTNERS SA provides no warranty and makes no representation of any kind whatsoever regarding the accuracy and completeness of any data, including financial market data or other financial instruments referred to in this general comment. This document does not constitute an offer or solicitation to any person in any jurisdiction in which such offer or solicitation is not authorized or to any person to whom it would be unlawful to make such offer or solicitation. Any reference in this document to specific securities and issuers are for illustrative purposes only, and should not be interpreted as recommendations to purchase or sell those securities. References in this document to investment funds that have not been registered with the FINMA cannot be distributed in or from Switzerland except to certain categories of eligible investors. Some of the entities of the NS Partners Group or its clients may hold a position in the financial instruments of any issuer discussed herein, or act as advisor to any such issuer. Additional information is available on request. © NS Partners Group

Protected: NS Investment Conference, 28 June 2022

This content is password-protected. To view it, please enter the password below.

Economic and financial consequences: How to reposition the portfolios.

The new environment after the Russian invasion of Ukraine.

How to reposition the portfolios.

The Russian invasion of Ukraine is having and will have an important impact in world politics for a generation or more: Europe is more united than ever; Russia has become a pariah among developed democratic countries; energy security is becoming a first priority for European countries, etc. What are the practical economic and financial consequences and how can investors profit from this environment?

Si vis pacem, para bellum

The first long-term negative consequence is that the “peace dividend” is over. As Julius Cesar said 2000 years ago, “if you want peace, prepare for war”. And so be it, Germany and Italy have already announced a significant increase in defense investments and other countries will follow. These investments for peace will decrease the amount available for other purposes. Investment opportunity: traditional defense stocks and cybersecurity companies.

Avoiding high valuations

The second negative consequence (in this case, short-term) is that the prices of many commodities are increasing very rapidly, which has a short-term impact on lower GDP growth and higher inflation. If we look at the futures markets, in one or two years, this impact may have disappeared as commodity prices will have come back to previous levels. In any case, the higher inflation rate expected will make central banks more hawkish in their monetary policies and hypergrowth stocks with demanding valuations should be avoided in the portfolios.

The ESG investment approach is as valid as before the war

Focusing on energy security

The most important short, medium and long term consequence is that countries are accelerating their pursuit of Energy Security (The new ES of the ESG investment?) to avoid their dependence on Russian oil and gas. In the oil crisis of the 70s after the Arab oil embargo, many countries started to invest in their nuclear power reactors to gain more energy independence. In this case, we foresee an acceleration of investment in wind and solar energy, battery storage, hydrogen and ammonia technologies, carbon sequestration, small size nuclear reactors, energy- saving devices, isolation materials, and other technologies linked to cleaner energy. This is a once-in-ageneration opportunity to invest in both public and private markets.

To look good

To accelerate this “cleaner energy” goal, there is need for what we can call “decarbonisation metals”, that include copper, lithium, rare earths, zinc, aluminum, cobalt, etc. Mining companies in this space are to be favored.

Health is always important

Health care companies will again be a favorite group as they (1) are defensive in a lower GDP growth environment; (2) are not much impacted by the increase in commodity prices; (3) have a secular growth as the population ages and (4) valuations are very good in pharmaceutical companies and reasonable in medical equipment companies.

As a final thought, the ESG investment approach is as valid as before the war, as we look for companies that will profit economically, while caring for the Environmental, Social and Governance aspects, and we have not excluded any company so far because of the nature of its business.

Graphique du mois – Conversation avec un gérant de portefeuille L/S dans le secteur de l’énergie

Conversation avec un gérant de portefeuille L/S dans le secteur de l’énergie

Source: UBS

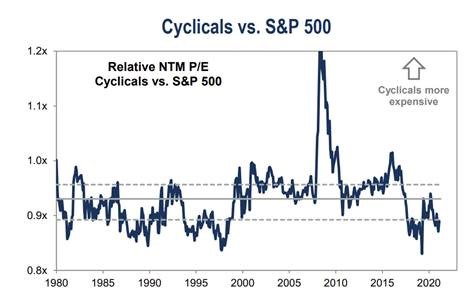
Le secteur mondial de l’énergie reste très bon marché par rapport à sa tendance historique, ce qui n’est pas le cas du marché dans son ensemble (les graphiques ci-dessous comparent les valorisations relatives entre les secteurs et le marché en général; le ratio cours/bénéfice de l’énergie est toujours de 11,8 fois, un niveau inférieur à ses moyennes historiques, alors que le marché affiche une prime proche de 20 fois).

Le potentiel de normalisation des multiples relatifs est donc très important entre titres value et valeurs croissance, surtout si l’on tient compte de l’accent mis par les équipes de direction des groupes énergétiques sur les performances et la rentabilité du capital (le secteur devrait enregistrer un ROCE >20% au cours des prochaines années, un niveau supérieur à tout autre secteur, ainsi que dans certains cas un rendement du capital à deux chiffres). La situation du secteur énergétique contraste avec celle de secteurs «stimulés» par la libération de la demande accumulée – c’est-à-dire la consommation discrétionnaire et les technologies de l’information, dont les valorisations sont encore élevées par rapport à leurs niveaux historiques.

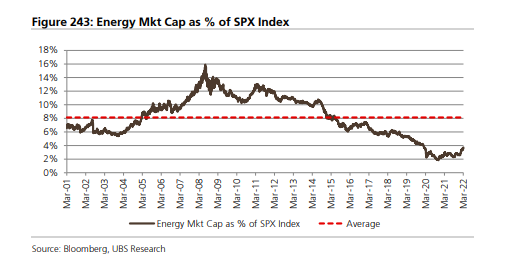
Le graphique ci-dessous présente la capitalisation boursière du secteur de l’énergie en pourcentage de l’indice S&P, qui reste proche de ses plus bas : 4% contre une moyenne de 8% sur 20 ans. Ce qui témoigne du degré de déconnexion entre sa valorisation et ses tendances historiques et le marché dans son ensemble.


Les performances passées ne garantissent pas les résultats futurs. Les opinions, stratégies et instruments financiers décrits dans le présent document peuvent ne pas convenir à tous les investisseurs. Les opinions énoncées sont celles valables à la date de publication de ce document. Toute référence aux indices de marches ou composites, indices de référence, ou autres mesures de performance relative des marches a une certaine période sont indiquées à titre d’information. NS Partners ne donne aucune garantie et n’est aucunement responsable de l’exactitude et de l’exhaustivité de l’ensemble des informations (données financières de marche, cours de bourse, avis de recherche ou description de tout autre instrument financier) contenus dans ce document. Le présent document n’est pas destiné aux personnes ou entités qui seraient citoyennes ou résidentes d’un lieu, état, pays ou juridiction dans lesquels sa distribution, sa publication, sa mise à disposition ou son utilisation seraient contraires aux lois ou règlements en vigueur. Les informations et données fournies dans le présent document sont communiquées à titre indicatif uniquement et ne constituent ni une offre, ni une incitation à acheter, vendre ou souscrire a des titres ou tout autre instrument financier. Il est fait référence dans ce document a des fonds d’investissement qui n’ont pas été enregistrés auprès de la Finma et ne peuvent donc pas être distribues en ou depuis la suisse sauf à certaines catégories d’investisseurs éligibles. Certaines des sociétés du groupe NS Partners ou ses clients peuvent être détenteurs d’une position dans les instruments financiers de l’un des émetteurs mentionnes dans ce document, ou agir en tant que consultant pour l’un d’eux. Des informations supplémentaires sont disponibles sur demande.

© Groupe NS Partners

Gráfico del mes – Conversación con un gestor de cartera L/S de energía

Conversación con un gestor de cartera L/S de energía

Source: UBS

El sector energético global sigue ofreciendo valoraciones muy bajas desde el punto de vista histórico, a diferencia del mercado en general (en los gráficos siguientes, donde se comparan las valoraciones relativas entre los distintos sectores y el mercado en general, las acciones energéticas siguen muestran todavía un ratio precio-beneficio de 11,8x, lo que supone un descuento con respecto a la media histórica, mientras que el mercado en general cotiza a aproximadamente 20x, una prima).

Por tanto, puede haber mucho margen para que los múltiplos relativos normalicen el value frente al growth, sobre todo si se tiene en cuenta el enfoque de los equipos de gestión de la energía en la rentabilidad y el retorno del capital (el sector está en condiciones de registrar un ROCE de más del 20% en los próximos años, compitiendo con cualquier sector del mercado, así como, en algunos casos, un retorno del capital de dos dígitos). Esto se compara con otros sectores «movidos por estímulos» con un tirón de la demanda, por ejemplo, el sector de consumo discrecional y tecnología de la información, que siguen presentando valoraciones desde el punto de vista histórico.

En el gráfico de abajo se muestra la capitalización bursátil del sector energético como porcentaje del S&P, que sigue prácticamente en mínimos: 4% frente a la media de 20 años del 8%. Esto muestra el grado de desvinculación de la valoración con las medidas históricas y el mercado en general.


Los resultados pasados no implican resultados futuros. Las opiniones, estrategias e instrumentos financieros que se describen en el presente documento pueden no ser convenientes para todos los inversores. Las opiniones expresadas son sólo las del momento en la(s) fecha(s) que aparece(n) en este material.  Las referencias a índices de mercado o compuestos, índices de referencia u otras medidas de resultados relativos de los mercados durante un período específico sólo se proveen a título informativo. NS Partners no garantiza ni es responsable de la exactitud o la integridad de las informaciones (datos financieros de mercado, precios de bolsa, resultados de investigación u otros instrumentos financieros) que se mencionan en este documento.  El presente documento no constituye una oferta ni solicitud a ninguna persona ni jurisdicción donde tal oferta o solicitud no esté autorizada ni a ninguna persona a quien sería ilegal hacer dicha oferta o solicitud. Toda referencia en este documento a instrumentos específicos o a emisores sólo tiene una finalidad ilustrativa y no debe ser interpretada como una recomendación para la compra o venta de dicho instrumento. Las referencias en este documento a fondos de inversión se aplican a fondos que no han sido registrados por la Finma y que por lo tanto no pueden ser distribuidos en o desde suiza excepto a ciertas categorías de inversores. Algunas de las empresas del grupo NS Partners o sus clientes pueden tener posiciones en los instrumentos financieros de alguno de los emisores mencionados en este documento, o ser asesor de uno de ellos. Hay información adicional disponible a solicitud.

© Grupo NS Partners

Chart of the Month – Conversation with an energy L/S portfolio manager

Conversation with an energy L/S portfolio manager

Source: UBS

The Global Energy Sector is still very cheap vs history – which differs from the broader market (charts below which compare relative valuations between different sectors and the broader market, Energy is still trading at 11.8x P/E, a discount to historical averages vs. the broader market trading at ~20x, a premium).

So potentially plenty of room for relative multiples to normalize value vs. growth, especially given the focus from energy management teams on return on and return of capital (the space is set to see >20% ROCE over the coming years, which competes with any market sector, as well as in some cases double digit return of capital yields). This compares to other ‘stimulus driven’ sectors where there is a pull forward of demand – ie, cons discretionary and info tech which are still elevated vs. historical valuations.

The chart below illustrates Energy Market Cap as percent of S&P, still close to the lows: 4% vs. 20 year average of 8%. This shows the degree of valuation disconnect vs. both historical measures and the broader market.


Past performance is not indicative of future results. The views, strategies and financial instruments described in this document may not be suitable for all investors. Opinions expressed are current opinions as of date(s) appearing in this material only. References to market or composite indices, benchmarks or other measures of relative market performance over a specified period of time are provided for your information only. NS Partners provides no warranty and makes no representation of any kind whatsoever regarding the accuracy and completeness of any data, including financial market data, quotes, research notes or other financial instrument referred to in this document. This document does not constitute an offer or solicitation to any person in any jurisdiction in which such offer or solicitation is not authorized or to any person to whom it would be unlawful to make such offer or solicitation. Any reference in this document to specific securities and issuers are for illustrative purposes only, and should not be interpreted as recommendations to purchase or sell those securities. References in this document to investment funds that have not been registered with the FINMA cannot be distributed in or from Switzerland except to certain categories of eligible investors. Some of the entities of the NS Partners Group or its clients may hold a position in the financial instruments of any issuer discussed herein, or act as advisor to any such issuer.  Additional information is available on request.

© NS Partners Group