January General Market Comments

January General Market Comments

“C’est comme ça” – Les Rita Mitsouko, 1986.

“C’est comme ça” could be translated into “That’s the way it is”; most markets were up in January, after a very painful December, but looking a tad longer term, it appears that, in general, markets have ended January 2023 not very far from the levels reached at the end of July 2022, with in between very nice months and very bad months, a common feature of all these months being a high level of volatility, as the MSCI World has moved in excess of 4% on the way up or on the way down every single month since July. We have to cope with high volatility when so many things are highly different than during the period 2017-2021, c’est comme ça…

Reasons for such a different context are well-known: higher inflation, higher interest rates, hawkish central banks, rising commodity prices, supply-chain issues and the war in Ukraine. Added to that, equity, fixed-income and credit markets started 2022 with demanding valuations, and if the latter have indeed corrected since then, they can’t be considered as cheap today, still. This means that volatility should stay with us for a while, and very much attention will be paid to economic data as well as Central Banks’ responses.

But let’s enjoy the party so far: the S&P 500 rose 6.2% in January, buoyed by its IT and Communication Services components notably; in this context, the Nasdaq added 10.6% and the MSCI World Growth 9.7% (versus “only” +4.6% for the MSCI World Value). Europe and Emerging Markets fared well (+6.7% and +7.9% respectively), with Japan lagging a smidgen (but still up 4.4%).

The month was also good for fixed-income and credit, as the US and the German 10 year yields fell 37 and 29 bps respectively and the Itraxx Crossover gained 3%. Helped by lower yields and a weaker dollar (-1.5% versus the euro), Gold soared 5.7%, while Oil retreated by 1.7%.

That’s it for this month’s Market Comments, stay tuned, markets never skip a beat.


Past performance is not indicative of future results. The views, strategies and financial instruments described in this document may not be suitable for all investors. Opinions expressed are current opinions as of date(s) appearing in this material only. References to market or composite indices, benchmarks or other measures of relative market performance over a specified period of time are provided for your information only. NS PARTNERS SA provides no warranty and makes no representation of any kind whatsoever regarding the accuracy and completeness of any data, including financial market data or other financial instruments referred to in this general comment. This document does not constitute an offer or solicitation to any person in any jurisdiction in which such offer or solicitation is not authorized or to any person to whom it would be unlawful to make such offer or solicitation. Any reference in this document to specific securities and issuers are for illustrative purposes only, and should not be interpreted as recommendations to purchase or sell those securities. References in this document to investment funds that have not been registered with the FINMA cannot be distributed in or from Switzerland except to certain categories of eligible investors. Some of the entities of the NS Partners Group or its clients may hold a position in the financial instruments of any issuer discussed herein, or act as advisor to any such issuer. Additional information is available on request. © NS Partners Group

December General Markets Comments

December General Markets Comments

“Heroes” – David Bowie, 1977.

2022 could have been year for heroes in financial markets. Imagine that, after Jay Powell’s announcement in November 2021 of higher for longer interest rates, you had positioned your portfolios for a 250 bps increase in US 10-year yields and for 8 Fed Funds Rates hikes totalling 425 bps. You would be a hero.

Even more a hero if you had bought energy stocks because you suspected that a war would break out in Europe and drive oil and gas prices through the roof. Even more again if you went short en vogue cryptocurrencies and Tesla, as both suffered very serious drawdowns for various reasons.

But at the end of the year, it appears that there were no heroes, as no one could have predicted the landslide changes the year 2022 witnessed. Years of accommodative monetary policies and peaceful times kind of hypnotized many investors who thought that Growth had beaten Value forever and that Central Bankers would always be market friendly. “We can beat them, forever and ever” says the song; 2022 shows once again that this does not apply for markets.

December has been a painful month, as evidenced by the negative returns posted by all asset classes, barring Gold (+3.14%): the S&P 500 abandoned 5.9%, the tech-heavy Nasdaq 9.1% (Tesla being a serious detractor with -36.7%), the MSCI Europe 3.6%, the Topix 4.7% and the MSCI Emerging Markets “only” 1.6%, helped by China’s U-turn on its zero-Covid stance.

Long-term yields rose again (+27 bps for the US 10-year, +64 bps for the Bund), in parallel with another month of underperformance from Growth versus Value (-6.15% and -2.6% respectively). Credit was flattish (-0.4% for the Itraxx Crossover), like Oil (-0.4%). The broad Commodities Index was down 0.7%.


Past performance is not indicative of future results. The views, strategies and financial instruments described in this document may not be suitable for all investors. Opinions expressed are current opinions as of date(s) appearing in this material only. References to market or composite indices, benchmarks or other measures of relative market performance over a specified period of time are provided for your information only. NS PARTNERS SA provides no warranty and makes no representation of any kind whatsoever regarding the accuracy and completeness of any data, including financial market data or other financial instruments referred to in this general comment. This document does not constitute an offer or solicitation to any person in any jurisdiction in which such offer or solicitation is not authorized or to any person to whom it would be unlawful to make such offer or solicitation. Any reference in this document to specific securities and issuers are for illustrative purposes only, and should not be interpreted as recommendations to purchase or sell those securities. References in this document to investment funds that have not been registered with the FINMA cannot be distributed in or from Switzerland except to certain categories of eligible investors. Some of the entities of the NS Partners Group or its clients may hold a position in the financial instruments of any issuer discussed herein, or act as advisor to any such issuer. Additional information is available on request. © NS Partners Group

Commentaires de marché – Novembre

Commentaires de marché – Novembre

“Don’t Stop” – Fleetwood Mac, 1977. Un hommage à la regrettée Christine McVie (1943-2022).

“Ne t’arrête pas” c’est ce que nous voudrions tous dire au marché après deux très bons mois consécutifs — une première cette année. Pour rappel, le MSCI World a progressé de près de 14% depuis fin septembre. La dernière fois qu’une reprise aussi spectaculaire a été enregistrée sur une période de deux mois remonte à novembre et décembre 2020, juste après l’annonce par Pfizer-BioNTech de la mise au point de leur vaccin contre la covid.

Parmi les nombreuses causes de ce puissant rebond, citons en premier lieu la Fed et les taux d’intérêt: les chiffres de l’inflation publiés au début du mois aux États-Unis semblent indiquer que le pic d’inflation pourrait être derrière nous, ce que Jerome Powell a plus ou moins soufflé dans son discours du 30 novembre. En conséquence, les taux souverains à long terme ont reculé, ce qui a quelque peu soutenu les valorisations. Par ailleurs, certains investisseurs nourrissent l’espoir que la politique chinoise du «zéro covid» s’avère tellement contraignante pour la population qu’il soit impossible pour le gouvernement de la maintenir sans mettre à mal la paix sociale. Or, un assouplissement des restrictions sanitaires chinoises serait favorable à la croissance mondiale, car il réduirait les tensions des chaînes d’approvisionnement et relancerait la consommation intérieure du pays. Enfin, les résultats du troisième trimestre ayant tous été publiés, les marchés se concentrent désormais sur les prévisions des entreprises, qui, en général, ne sont pas si mauvaises. Quant à la débâcle de FTX, elle nous offre une excellente occasion de mettre en avant quelques grandes chansons de Fleetwood Mac, car les «Petits mensonges» (Little Lies) de M. SBF n’ont provoqué aucun «Raz de marée» (Landslide) et n’ont pas non plus brisé «La chaîne» (The Chain) des marchés traditionnels: «Passez votre chemin» (Go Your Own Way), M. SBF.

Le MSCI World a gagné 6,8% le mois dernier, le S&P500 5,4% et le MSCI Europe 6,7%. Mais la vedette du mois est sans conteste le MSCI Emerging Markets, qui a bondi de 14,6% (malgré un repli de 21,1% sur l’année 2022). Pour une fois, les actions de croissance n’ont pas surperformé les actions décotées au cours d’un mois de baisse des taux d’intérêt, ce qui est assez inhabituel. Les marchés obligataires et du crédit ont également profité du rebond: les taux à 10 ans américains et allemands ont reculé respectivement de 44 et 21 points de base, et l’Itraxx Crossover a recouvré près de la moitié de ses pertes de l’année avec une hausse de 4,5%. Le pétrole a encore reculé de 6,9%, tandis que l’or, soutenu par la baisse des rendements réels, a gagné 8,3%.


Les performances passées ne garantissent pas les résultats futurs. Les opinions, stratégies et instruments financiers décrits dans le présent document peuvent ne pas convenir à tous les investisseurs. Les opinions énoncées sont celles valables à la date de publication de ce document. Toute référence aux indices de marches ou composites, indices de référence, ou autres mesures de performance relative des marches a une certaine période sont indiquées à titre d’information. NS Partners ne donne aucune garantie et n’est aucunement responsable de l’exactitude et de l’exhaustivité de l’ensemble des informations (données financières de marche, cours de bourse, avis de recherche ou description de tout autre instrument financier) contenus dans ce document. Le présent document n’est pas destiné aux personnes ou entités qui seraient citoyennes ou résidentes d’un lieu, état, pays ou juridiction dans lesquels sa distribution, sa publication, sa mise à disposition ou son utilisation seraient contraires aux lois ou règlements en vigueur. Les informations et données fournies dans le présent document sont communiquées à titre indicatif uniquement et ne constituent ni une offre, ni une incitation à acheter, vendre ou souscrire a des titres ou tout autre instrument financier. Il est fait référence dans ce document a des fonds d’investissement qui n’ont pas été enregistrés auprès de la Finma et ne peuvent donc pas être distribues en ou depuis la suisse sauf à certaines catégories d’investisseurs éligibles. Certaines des sociétés du groupe NS Partners ou ses clients peuvent être détenteurs d’une position dans les instruments financiers de l’un des émetteurs mentionnes dans ce document, ou agir en tant que consultant pour l’un d’eux. Des informations supplémentaires sont disponibles sur demande. © Groupe NS Partners

November General Markets Comments

November General Markets Comments

“Don’t Stop” – Fleetwood Mac, 1977. A tribute to the late Christine McVie (1943-2022).

“Don’t stop” is what we all would like to say to markets after two very good months in a row, for the first time this year. For the record, the MSCI World has risen close to 14% since the end of September, the last time such a spectacular return happened on a two- month timeframe was in November and December 2020, right after Pfizer-BioNTech made public they had a vaccine against Covid.

The multifarious causes behind such a strong rebound are, first and foremost, the Fed and interest rates: inflation numbers published at the beginning of the month in the US seem to indicate that peak inflation might be behind us, which Jerome Powell more or less whispered in his November 30th speech. Long-term government bond yields consequently fell, offering some support to valuations. There are also some hopes among the investment community that China’s zero-Covid policies prove too much of a burden on the population for the government to maintain them without stymieing social calm; should China loosen its harsh sanitary measures, global growth would benefit from some relief on the supply-chain side and increased consumption in the country. Finally, as the Q3 earnings reports have all been published, markets now focus on the guidance provided by the corporate world, which, in general, was not that bad. Finally, the FTX debacle brings the opportunity to highlight some great Fleetwood Mac songs, as the “Little Lies” of Mr SBF did not provoke any “Landslide”, nor did it break “The Chain” in traditional markets; you can “Go Your Own Way”, Mr SBF.

The MSCI World added 6.8% last month, the S&P500 5.4% and the MSCI Europe 6.7%; but the star of the month was the MSCI Emerging Markets, which soared 14.6% (but is still down 21.1% in 2022); for once, Growth did not outperform Value in a month of falling interest rates, quite an unusual fact. Fixed income and credit markets also enjoyed the rally: the US and German10-year yields respectively fell 44 and 21 bps, and the Itraxx Crossover recouped almost half of its yearly losses with a 4.5% rise. Oil fell again (-6.9%), and Gold returned 8.3%, buoyed by falling real yields.


Past performance is not indicative of future results. The views, strategies and financial instruments described in this document may not be suitable for all investors. Opinions expressed are current opinions as of date(s) appearing in this material only. References to market or composite indices, benchmarks or other measures of relative market performance over a specified period of time are provided for your information only. NS PARTNERS SA provides no warranty and makes no representation of any kind whatsoever regarding the accuracy and completeness of any data, including financial market data or other financial instruments referred to in this general comment. This document does not constitute an offer or solicitation to any person in any jurisdiction in which such offer or solicitation is not authorized or to any person to whom it would be unlawful to make such offer or solicitation. Any reference in this document to specific securities and issuers are for illustrative purposes only, and should not be interpreted as recommendations to purchase or sell those securities. References in this document to investment funds that have not been registered with the FINMA cannot be distributed in or from Switzerland except to certain categories of eligible investors. Some of the entities of the NS Partners Group or its clients may hold a position in the financial instruments of any issuer discussed herein, or act as advisor to any such issuer. Additional information is available on request. © NS Partners Group

October General Markets Comments

October General Markets Comments

«Fade Out Lines» – The Avener Rework, 2014

Charts lines from the 12 to 18 post-covid months are gradually fading out, and it seems markets are coming back to earth after an incredible run on speculative and/or expensive assets from March 2020 to November 2021. These roller coaster capital markets make investors feel dizzy, at least a smidgen. Pirouetting from the downside to the upside, markets logically give rise to howls calling for a looming disaster, or, conversely, for the beginning of a new bull phase.

Whatever the trigger, excesses always end up badly; but as they deflate, opportunities arise, and it seems that October 2022 was a month of opportunities. At a time of crucial reports from the IT and Communication Services behemoths, one could have expected that the latter would dictate the overall market mood; in fact, they did not. Markets can do anything, and they proved again how tough it is to assess their reactions. Reports from the Big Boys were mostly disappointing, but this did not prevent Global Equities from posting spectacular returns, as shown by the +7.11% performance of the MSCI World in October.

Not only did the MSCI World perform well, but all other major indices also rose significantly (S&P 500 +7.99%, MSCI Europe +6.15%, Topix +5.09%, Nasdaq +3.96%), barring the MSCI Emerging Markets, which abandoned 3.15%, penalized by the Chinese market essentially (-7.99%).

With interest rates rising again (+22 bps and +3 bps for the US and the German 10 year respectively), Value fared much better than Growth (+9.58% for Global Value versus +4.56% for Global Growth), and Gold lost ground again (-1.63%); the shiny stuff, very symbolically, now lags the Dow Jones Industrial year to date (-10.70% vs -9.9%), quite a surprise in a year marked by rising inflation and war. Credit had a very good month, the Itraxx Crossover gained 3.65%, and Oil finally broke a 4-month losing streak by adding 8.9%.


Past performance is not indicative of future results. The views, strategies and financial instruments described in this document may not be suitable for all investors. Opinions expressed are current opinions as of date(s) appearing in this material only. References to market or composite indices, benchmarks or other measures of relative market performance over a specified period of time are provided for your information only. NS PARTNERS SA provides no warranty and makes no representation of any kind whatsoever regarding the accuracy and completeness of any data, including financial market data or other financial instruments referred to in this general comment. This document does not constitute an offer or solicitation to any person in any jurisdiction in which such offer or solicitation is not authorized or to any person to whom it would be unlawful to make such offer or solicitation. Any reference in this document to specific securities and issuers are for illustrative purposes only, and should not be interpreted as recommendations to purchase or sell those securities. References in this document to investment funds that have not been registered with the FINMA cannot be distributed in or from Switzerland except to certain categories of eligible investors. Some of the entities of the NS Partners Group or its clients may hold a position in the financial instruments of any issuer discussed herein, or act as advisor to any such issuer. Additional information is available on request. © NS Partners Group

September General Markets Comments

September General Markets Comments

« Another one bites the dust » – Queen, 1980

Well, another one, and many others? Equity markets already did, as well as fixed-income securities overall. September saw the British Pound on its knees, Gold breaking down, Oil recording its largest loss this year and Credit Suisse’s CDS rising to 2008 levels; FedEx and Nike had very bad days on the stock exchange, and Italy’s spread versus Germany widens by the day . On the front, the Russian army also bit the dust and is losing ground.

All asset classes suffered in September, with the continuous pressure exerted by long term interest rates, which, once again, rose significantly.

With hindsight, it looks like under the direction of conductor Jerome Powell, we’re gradually picking up where we left off, before February 2020 and the Covid outbreak, which led to all kinds of excesses and aberrations, triggered by the profligacy of Central Banks and Governments.

The S&P 500 lost no less than 9.3% in September, and the Nasdaq 10.6%; the MSCI Emerging Markets sunk 11.9% and now lags all major indices, barring the Topix, which is only down 7.9% year-to-date (but the Yen cratered by 25.8% versus the dollar!). Growth stood behind Value, once again, and lost 10.2% last month; the MSCI World Growth is down 32.8% this year, versus -20.1% for the MSCI World Value. This has to be put in the context of ever rising interest rates: the US 10-year yield added 64 bps (+57 bps for Germany) and is now 232 bps higher than the level prevailing at the beginning of 2022 (+229 bps for the Bund). Oil abandoned 11.2% and Gold 3%. Credit somewhat resisted, with the Itraxx Crossover “only” down 41 bps.


Past performance is not indicative of future results. The views, strategies and financial instruments described in this document may not be suitable for all investors. Opinions expressed are current opinions as of date(s) appearing in this material only. References to market or composite indices, benchmarks or other measures of relative market performance over a specified period of time are provided for your information only. NS PARTNERS SA provides no warranty and makes no representation of any kind whatsoever regarding the accuracy and completeness of any data, including financial market data or other financial instruments referred to in this general comment. This document does not constitute an offer or solicitation to any person in any jurisdiction in which such offer or solicitation is not authorized or to any person to whom it would be unlawful to make such offer or solicitation. Any reference in this document to specific securities and issuers are for illustrative purposes only, and should not be interpreted as recommendations to purchase or sell those securities. References in this document to investment funds that have not been registered with the FINMA cannot be distributed in or from Switzerland except to certain categories of eligible investors. Some of the entities of the NS Partners Group or its clients may hold a position in the financial instruments of any issuer discussed herein, or act as advisor to any such issuer. Additional information is available on request. © NS Partners Group

Chart of the Month – Shifting gears in the equity markets

Shifting gears in the equity markets

Source: Bloomberg, IBES, NS Partners

The two main drivers of equity markets are liquidity (provided by the Central Banks) and earnings (provided by corporations). When both drivers are favourable, equity performance is extremely good. In the graph above you can see two very good periods reflecting this:

  • (ORANGE): Earnings recovered very fast after the Global Financial Crisis of 2008 and also after the initial stages of the Covid pandemic.
  • (BLACK): FED rates tumbled to almost 0% after the Global Financial Crisis of 2008 and again during the Covid pandemic.
  • (BLUE). The SP500 performed extremely well when the two tail winds blew in the same direction: 16.5% CAGR during the 2009-13 period, and 30% CAGR since April 2020.

But the party cannot last forever, and Central Banks will start tightening and withdrawing liquidity once the economy recovers. The graph shows this situation during the period of Jun13 to Dec18 when the FED started tapering, and then hiking rates. This was an earnings driven market where profits continued to increase while liquidity was reduced by Central Banks. Still the equity market managed to achieve a respectable 9% CAGR performance.

Where are we now? Thanks to the combined efforts of the scientific world (vaccines), Central Banks (rate cuts + bond purchases) and Governments (huge fiscal packages) the world economy has recovered well, so the economy no longer needs assistance from Central Banks. They have either started to reduce liquidity (Bank of England, Norway…), or will do so during 2022 (FED, ECB, …)


WHAT CAN WE EXPECT FOR 2022?

  • (BLACK): The FED will gradually stop buying bonds by April 2022; during 2022 the FED rates will likely increase 3 times, by 0.25% each time. This will be a headwind for the market. Remember the old saying: “Don’t fight the FED”.
  • (ORANGE): Earnings have recovered very fast in 2021 and will continue to increase in 2022 and 2023, but at a lower rate of 10% according to IBES estimates, which is much less than the 25% increase that we enjoyed in 2021.
  • (BLUE). The SP500 will likely rise again in 2022 but with the headwinds from the Central Banks and the lower EPS growth, the market will probably shift down a gear to deliver a return of 5% to 10% performance during 2022.


Past performance is not indicative of future results. The views, strategies and financial instruments described in this document may not be suitable for all investors. Opinions expressed are current opinions as of date(s) appearing in this material only.

References to market or composite indices, benchmarks or other measures of relative market performance over a specified period of time are provided for your information only. NS Partners provides no warranty and makes no representation of any kind whatsoever regarding the accuracy and completeness of any data, including financial market data, quotes, research notes or other financial instrument referred to in this document.

This document does not constitute an offer or solicitation to any person in any jurisdiction in which such offer or solicitation is not authorized or to any person to whom it would be unlawful to make such offer or solicitation. Any reference in this document to specific securities and issuers are for illustrative purposes only, and should not be interpreted as recommendations to purchase or sell those securities. References in this document to investment funds that have not been registered with the FINMA cannot be distributed in or from Switzerland except to certain categories of eligible investors. Some of the entities of the NS Partners Group or its clients may hold a position in the financial instruments of any issuer discussed herein, or act as advisor to any such issuer.

 Additional information is available on request.

© NS Partners Group

Chart of the Month – Shifting gears in the equity markets

Shifting gears in the equity markets

Source: Bloomberg, IBES, NS Partners

The two main drivers of equity markets are liquidity (provided by the Central Banks) and earnings (provided by corporations). When both drivers are favourable, equity performance is extremely good. In the graph above you can see two very good periods reflecting this:

  • (ORANGE): Earnings recovered very fast after the Great Recession of 2008 and also after the initial stages of the Covid pandemic.
  • (BLACK): FED rates tumbled to almost 0% after the Great Recession of 2008 and again during the Covid pandemic.
  • (BLUE). The SP500 performed extremely well when the two tail winds blew in the same direction: 16.5% CAGR during the 2009-13 period, and 30% CAGR since April 2020.

But the party cannot last forever, and Central Banks will start tightening and withdrawing liquidity once the economy recovers. The graph shows this situation during the period of Jun13 to Dec18 when the FED started tapering, and then hiking rates. This was an earnings driven market where profits continued to increase while liquidity was reduced by Central anks. Still the equity market managed to achieve a respectable 9% CAGR performance.

Where are we now? Thanks to the combined efforts of the scientific world (vaccines), Central Banks (rate cuts + bond purchases) and Governments (huge fiscal packages) the world economy has recovered well, so the economy no longer needs assistance from Central Banks. They have either started to reduce liquidity (Bank of England, Norway…), or will do so during 2022 (FED, ECB, …)


WHAT CAN WE EXPECT FOR 2022?

  • (BLACK): The FED will gradually stop buying bonds by April 2022; during 2022 the FED rates will likely increase 3 times, by 0.25% each time. This will be a headwind for the market. Remember the old saying: “Don’t fight the FED”.
  • (ORANGE): Earnings have recovered very fast in 2021 and will continue to increase in 2022 and 2023, but at a lower rate of 10% according to IBES estimates, which is much less than the 25% increase that we enjoyed in 2021.
  • (BLUE). The SP500 will likely rise again in 2022 but with the headwinds from the Central Banks and the lower EPS growth, the market will probably shift down a gear to deliver a return of 5% to 10% performance during 2022.


Past performance is not indicative of future results. The views, strategies and financial instruments described in this document may not be suitable for all investors. Opinions expressed are current opinions as of date(s) appearing in this material only.

References to market or composite indices, benchmarks or other measures of relative market performance over a specified period of time are provided for your information only. NS Partners provides no warranty and makes no representation of any kind whatsoever regarding the accuracy and completeness of any data, including financial market data, quotes, research notes or other financial instrument referred to in this document.

This document does not constitute an offer or solicitation to any person in any jurisdiction in which such offer or solicitation is not authorized or to any person to whom it would be unlawful to make such offer or solicitation. Any reference in this document to specific securities and issuers are for illustrative purposes only, and should not be interpreted as recommendations to purchase or sell those securities. References in this document to investment funds that have not been registered with the FINMA cannot be distributed in or from Switzerland except to certain categories of eligible investors. Some of the entities of the NS Partners Group or its clients may hold a position in the financial instruments of any issuer discussed herein, or act as advisor to any such issuer.

 Additional information is available on request.

© NS Partners Group

Chart of the Month – Shifting gears in the equity markets

Shifting gears in the equity markets

Source: Bloomberg, IBES, NS Partners

The two main drivers of equity markets are liquidity (provided by the Central Banks) and earnings (provided by corporations). When both drivers are favourable, equity performance is extremely good. In the graph above you can see two very good periods reflecting this:

  • (ORANGE): Earnings recovered very fast after the Great Recession of 2008 and also after the initial stages of the Covid pandemic.
  • (BLACK): FED rates tumbled to almost 0% after the Great Recession of 2008 and again during the Covid pandemic.
  • (BLUE). The SP500 performed extremely well when the two tail winds blew in the same direction: 16.5% CAGR during the 2009-13 period, and 30% CAGR since April 2020.

But the party cannot last forever, and Central Banks will start tightening and withdrawing liquidity once the economy recovers. The graph shows this situation during the period of Jun13 to Dec18 when the FED started tapering, and then hiking rates. This was an earnings driven market where profits continued to increase while liquidity was reduced by Central anks. Still the equity market managed to achieve a respectable 9% CAGR performance.

Where are we now? Thanks to the combined efforts of the scientific world (vaccines), Central Banks (rate cuts + bond purchases) and Governments (huge fiscal packages) the world economy has recovered well, so the economy no longer needs assistance from Central Banks. They have either started to reduce liquidity (Bank of England, Norway…), or will do so during 2022 (FED, ECB, …)


WHAT CAN WE EXPECT FOR 2022?

  • (BLACK): The FED will gradually stop buying bonds by April 2022; during 2022 the FED rates will likely increase 3 times, by 0.25% each time. This will be a headwind for the market. Remember the old saying: “Don’t fight the FED”.
  • (ORANGE): Earnings have recovered very fast in 2021 and will continue to increase in 2022 and 2023, but at a lower rate of 10% according to IBES estimates, which is much less than the 25% increase that we enjoyed in 2021.
  • (BLUE). The SP500 will likely rise again in 2022 but with the headwinds from the Central Banks and the lower EPS growth, the market will probably shift down a gear to deliver a return of 5% to 10% performance during 2022.


Past performance is not indicative of future results. The views, strategies and financial instruments described in this document may not be suitable for all investors. Opinions expressed are current opinions as of date(s) appearing in this material only.

References to market or composite indices, benchmarks or other measures of relative market performance over a specified period of time are provided for your information only. NS Partners provides no warranty and makes no representation of any kind whatsoever regarding the accuracy and completeness of any data, including financial market data, quotes, research notes or other financial instrument referred to in this document.

This document does not constitute an offer or solicitation to any person in any jurisdiction in which such offer or solicitation is not authorized or to any person to whom it would be unlawful to make such offer or solicitation. Any reference in this document to specific securities and issuers are for illustrative purposes only, and should not be interpreted as recommendations to purchase or sell those securities. References in this document to investment funds that have not been registered with the FINMA cannot be distributed in or from Switzerland except to certain categories of eligible investors. Some of the entities of the NS Partners Group or its clients may hold a position in the financial instruments of any issuer discussed herein, or act as advisor to any such issuer.

 Additional information is available on request.

© NS Partners Group

Chart of the Month – «If you ask me anything I don’t know, I’m not going to answer» Yogi Berra

Chart  of the month «If you ask me anything I don’t know, I’m not going to answer» Yogi Berra

Source: Stifel Nicolaus, Notz Stucki

And yes, here we go again with one of Yogi Berra’s insightful quote, which, this time, applies for the fate of the economy. It’s anybody’s guess today to give an indication of where the global economy is headed for the next 12 to 24 months, which should not come as a surprise considering the multiple unknowns ahead of us.

First come, first serve, the Covid crisis seems far from abating and its consequences, although now roughly measurable for its first wave, are as opaque as the horizon on a foggy day on Golden Gate Bridge when it comes to its second wave. The outcome of the US elections will have an influence on the US and the global economy (tax increases, domestic stimulus); how will the European economy get out of the current dire straits in which it is stuck; what happens next with the immense amounts of liquidity and debt generated since the start of the crisis; what are the next steps in the China-US economic war; and the list goes on.

Equity markets seem so far to give hope a chance as they’ve recovered sharply from the March lows, but we know things can revert very fast and, amidst this stock prices recovery, there has been an extreme differentiation between sectors, which means that the global picture isn’t that clear for investors.

There’s a very silent economist, who very seldom appears, and whose message is almost always accurate: that’s the US yield curve, and in particular the 3 month-10 year steepness.

Does the US yield curve know something we don’t, as it did many times in the past?

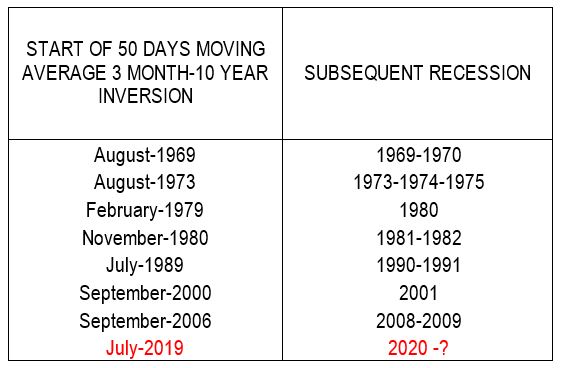
There have been 8 recessions in the US since 1969, including the current one. These 8 recessions had been announced in advance as shown on the table above by an inversion of the 50 days moving average of the US 3month-10 years yield differential (i.e. 3 month rates exceeding 10 years rates).

Very few paid attention to 2019’s inversion which happened in a buoyant mood for equity markets and, frankly, no cloud sufficiently big to make anybody contrarian enough to predict a recession in 2020. And this recession happened, for exogeneous factors (COVID-19) which, mid-2019, was totally unpredictable!

Now the good news, if we believe in the predictive power of the yield curve: it reverted into positive steepness in December 2019, and is now at its steepest point since then with a 57 basis points difference.

So if you’re questioned about something you don’t know, say the economy (nobody can predict the economy), you’re not going to answer; but the yield curve will. And today it’s a positive message.


Past performance is not indicative of future results. The views, strategies and financial instruments described in this document may not be suitable for all investors. Opinions expressed are current opinions as of date(s) appearing in this material only.

References to market or composite indices, benchmarks or other measures of relative market performance over a specified period of time are provided for your information only. Notz, Stucki provides no warranty and makes no representation of any kind whatsoever regarding the accuracy and completeness of any data, including financial market data, quotes, research notes or other financial instrument referred to in this document.

This document does not constitute an offer or solicitation to any person in any jurisdiction in which such offer or solicitation is not authorized or to any person to whom it would be unlawful to make such offer or solicitation. Any reference in this document to specific securities and issuers are for illustrative purposes only, and should not be interpreted as recommendations to purchase or sell those securities. References in this document to investment funds that have not been registered with the FINMA cannot be distributed in or from Switzerland except to certain categories of eligible investors. Some of the entities of the Notz Stucki Group or its clients may hold a position in the financial instruments of any issuer discussed herein, or act as advisor to any such issuer.

 Additional information is available on request.

© Notz Stucki Group