Chart of the Month – Rotations

Rotations


I personally love skiing.

Like all ski addicts, I know what rotation means:

  1. Feet and knees trigger a change in orientation.
  2. Edge grip
  3. The upper body stays in front of the slope and does not rotate.
  4. The turn is controlled and mastered.
  5. Conclusion: rotation is necessary, good and helps

Like all equity portfolio managers, I know what rotation means:

  1. Growth outperforms Value, or Value outperforms Growth, in this secular opposition between styles.
  2. This happens whatever the direction of the market.
  3. A portfolio can suffer or profit from rotations.
  4. It is awfully difficult to time the market, and, on top of that, to time rotations.
  5. Conclusion: rotation is potentially dangerous

It’s easy to see that in skiing you are the source of the rotation, whereas in equity investing you are subject to it.

rotationsThe Chart of the Month is divided in two parts:

  1. The upper part shows the performance of the MSCI World Net Total Return in euros since 2017. It has more than doubled.
  2. The orange line in the lower part displays the relative performance of the MSCI World Growth versus the rest of the market. It has bettered the MSCI World by more than 20%, but how volatile this has been! And the blue line represents the relative performance of our equity flagship DGC Stock Selection, which has done better than both the MSCI World and the MSCI World Growth over the period.

Investors have a natural tendency to try to time the market; this is very frequently a failure. Looking at all the rotations highlighted in the Chart of the Month, they also have to cope with styles, adding another risk of failure.

We believe at NS Partners that we offer a comprehensive and reasonable equity exposure with a blended global equity fund with no style bias, as shown by the blue line in the chart of the month. As you can see, our DGC Stock Selection fund has been able to deliver an appreciable outperformance, without having been biased towards Growth or Value, but by applying a disciplined approach in terms of valuations and quality.

History tells us that long periods of outperformance from one style versus another tend to correct, but the timing is uncertain. We expect many more rotations in the future.

Like an advanced skier who will always keep his shoulders in front of the slope to make sure he controls his trajectory while rotating his feet and knees, our fund will continue to focus on quality and valuations, whatever the sector, in order to smooth out style rotations and, hopefully, deliver superior performance for investors going forward.


Past performance is not indicative of future results. The views, strategies and financial instruments described in this document may not be suitable for all investors. Opinions expressed are current opinions as of date(s) appearing in this material only. References to market or composite indices, benchmarks or other measures of relative market performance over a specified period of time are provided for your information only. NS Partners provides no warranty and makes no representation of any kind whatsoever regarding the accuracy and completeness of any data, including financial market data, quotes, research notes or other financial instrument referred to in this document. This document does not constitute an offer or solicitation to any person in any jurisdiction in which such offer or solicitation is not authorized or to any person to whom it would be unlawful to make such offer or solicitation. Any reference in this document to specific securities and issuers are for illustrative purposes only, and should not be interpreted as recommendations to purchase or sell those securities. References in this document to investment funds that have not been registered with the FINMA cannot be distributed in or from Switzerland except to certain categories of eligible investors. Some of the entities of the NS Partners Group or its clients may hold a position in the financial instruments of any issuer discussed herein, or act as advisor to any such issuer.  Additional information is available on request.
© NS Partners Group

Hedge funds: what positioning for 2024?

Preference for macro, equity and credit long/short strategies, but caution on multi-manager platforms.

A MIXED 2023

While equities enjoyed a positive start to 2023, hedge funds got off to a more mixed start. Indeed, following fears of a global economic slowdown, long/short equity managers started the year on a cautious note, maintaining a rather low net exposure to the market. For their part, global macro managers were hit by sharp reversals in trends, highlighted by the record fall in US 10-year yields following the regional banking crisis in the United States and the collapse of Credit Suisse.

Finally, after a remarkable 2022, relative value strategies, now dominated by the large multi-manager platforms, also stalled and were unable to keep pace with the rise in risk-free rates, which is their minimum target. But in the end – and it is true that the last two months of the year were particularly favourable – a diversified hedge fund portfolio was able to post a double-digit net return in 2023.

WHAT CAN WE EXPECT FROM 2024 AT MACRO LEVEL?

What about 2024? We are currently at a crossroads in terms of monetary policy. In fact, with the exception of Japan, the major central banks are now prepared, in the more or less short term, to lower their interest rates depending on the trend in inflation and economic growth. For their part, although the opinions of macro managers vary considerably, they generally agree that the market is hoping for a faster rate cut in the United States than might actually occur. With interest-rate volatility higher than that of equities, managers have reduced their risk allocations.

Certain themes, which did not always pay off in 2023, are still present in portfolios, such as bets on metals linked to the energy transition, particularly copper, on the normalisation of Japanese monetary policy and on long positions in certain emerging markets (Brazilian interest rates, Mexico, credit). After a year of contrasting results in 2023, macro managers should be well positioned to take advantage of volatility on the fixed-income, currency and commodities markets.

A STABILISED ENVIRONMENT FOR LONG/SHORT EQUITY MANAGERS

The ‘soft landing’ scenario that seems to be holding sway is giving a little more peace of mind to long/short equity managers, who have significantly increased their net exposure to the market in recent months. But make no mistake: good global long/short managers have posted returns of between +15% and +20% in 2023 – compared with an MSCI World index up by +21.8% – which constitutes positive alpha generation, firstly because of their exposure to the market of only around +60% and secondly because of their underweighting of the seven technology megastocks that have driven the market. Even Asian managers with a bias towards China posted positive returns over the past year, while the MSCI China index fell by -13.2% in 2023.

On the other hand, if there is one strategy that shows a little more cyclicality, it is the long/short equity strategy. At this stage, we believe that we are still in a cycle of rising alpha generation. What’s more, with the normalisation of interest rates and the fact that we are finally being paid to short stocks, we believe that a selection of good long/short managers is a good complement to an equity allocation in a portfolio. Perhaps it’s time to diversify your geographical allocation a little outside the US.

QUESTIONS ABOUT MULTI-MANAGER PLATFORMS

Multi-manager platforms have been the big winners in recent years. Since 2017, their assets under management have increased by +186% and the seven largest platforms, including Citadel, Millennium, Point 72 and Balyasny, now account for over 60% of the market share in this category. The asset class approaches and exposures vary from one company to another, so it is not always easy to compare them. That said, they are now waging a merciless war to attract the best traders, who are paid handsomely, which has an impact on costs.

In these platforms, a successful manager can receive performance fees even if the overall result is zero or even negative, which translates into what is known as ‘netting risk’. This risk can materialise more quickly if the performance of the funds falls short of expectations. For platforms that have experienced rapid growth, it will be necessary to digest the assets and assess whether there is any dilution of the added value in the final result. In addition, with liquidity requirements having become more restrictive, we now have to be very selective.

Finally, to conclude our overview of the positioning to adopt in 2024, we believe that good long/short credit managers should be able to generate attractive returns in the market environment that awaits us over the next few months.

In conclusion, the key to obtaining a satisfactory result from your hedge fund portfolio is to define your expectations clearly, as the construction and development of your portfolio will depend directly on this. To be successful, however, you need to bear in mind two important factors: firstly, you need to make a good selection beforehand, and secondly, you need to be as contrarian as possible.

June General Market Comments

June General Market Comments

« Driver’s Seat » – Sniff ‘n’ the Tears, 1978

AI, Big Tech and consequently the Nasdaq are in the driver’s seat in 2023. They’ve set the pace for what is, so far, a very good year for global equity markets, notwithstanding the immense performance gap between sectors and styles: to wit, the MSCI World Growth is up 26.5% at the end of June, versus only +2.5% for the MSCI World Value.

June 2023 saw, from the middle of the month, some kind of marginal rebalancing: upside participation has been a tad broader than previously this year, which is healthy (the S&P 500 and the Nasdaq ended up the month with almost exactly the same performance, slightly below +6.5%). This is also logical because interest rates were not supportive of expanding valuations last month: the US and German 10 year yields respectively rose 19 and 11 bps.

In the meantime, Credit was up again (+2% for the Itraxx Crossover in June, +7.6% year to date), Gold lost ground (-2.2%) as well as the dollar versus the euro. Currency markets have also shown some large moves this year, as the euro is up 1.9% versus the dollar, but the most impressive is the Japanese Yen fall (-10.1%) and, to a lesser extent, the Chinese Renminbi (-5.2%). The spectacular 21% upside in the Topix finally “only” translates into a +10% return year to date in USD.

Markets seems to tell us that the Fed will succeed in engineering a soft landing in the US, especially if upside participation broadens; markets often lead fundamentals, so this should be viewed as good news. What remains unclear is the capacity for valuations, and in particular for the most hype sectors, to stay at these levels.

That’s it for this month’s Market Comments, stay tuned, markets never skip a beat.


Past performance is not indicative of future results. The views, strategies and financial instruments described in this document may not be suitable for all investors. Opinions expressed are current opinions as of date(s) appearing in this material only. References to market or composite indices, benchmarks or other measures of relative market performance over a specified period of time are provided for your information only. NS PARTNERS SA provides no warranty and makes no representation of any kind whatsoever regarding the accuracy and completeness of any data, including financial market data or other financial instruments referred to in this general comment. This document does not constitute an offer or solicitation to any person in any jurisdiction in which such offer or solicitation is not authorized or to any person to whom it would be unlawful to make such offer or solicitation. Any reference in this document to specific securities and issuers are for illustrative purposes only, and should not be interpreted as recommendations to purchase or sell those securities. References in this document to investment funds that have not been registered with the FINMA cannot be distributed in or from Switzerland except to certain categories of eligible investors. Some of the entities of the NS Partners Group or its clients may hold a position in the financial instruments of any issuer discussed herein, or act as advisor to any such issuer. Additional information is available on request. © NS Partners Group

May General Market Comments

May General Market Comments

“Steamy Windows”, 1989 – A tribute to the legendary and immortal Tina Turner.

Trying to decipher the messages sent by economies and markets feels like trying to guess what lies behind steamy windows; you have an idea, but it’s not precise. Not more than 1 year ago, consensus was that a recession was inevitable in Europe and highly likely in the US, whereas it’s far less certain today; meanwhile, if not done yet, the Fed seems close to end its hiking cycle. China reopening should have triggered a massive boom for its equity market and commodities, but it hasn’t. Debt ceiling fuzz saw the dollar rise while the last minute deal, avoiding a default, has been followed by dollar weakness. Beyond an unclear short term horizon, two gigantic long term investment cycles still prevail: Digitalization and Cleaner Energy.
The crazy hype around AI and Nvidia shouldn’t make us lose sight of the fact that there will be profound consequences in terms of productivity with the widespread use of AI.
May 2023 was one of these very complicated months for equity investors who, if they were not exposed to the happy few rising stocks, had good reasons to be frustrated; the S&P 500 was almost flat, but it would have significantly been down without the contribution from mega-IT components who, besides the S&P, propelled the Nasdaq 100 7.6% higher. The absence of IT behemoths has cruelly been felt by Europe and Emerging Markets (down 3.2% and 1.9%), while Japan rose (+3.6%) with a weak JPY. Growth unsurprisingly humiliated Value (+2.3% vs -5.0%), while the strength of the dollar weighed on the MSCI World, which ended up the month down 1.3%.
Fixed-income was mixed: US 10 year yield rose 22 bps, Germany was stable and Italy, a good gauge of risk aversion, saw its 10 year benchmark yield fall by 9 bps. Credit enjoyed another very good month (+0.7% for the Itraxx Crossover), while all commodities plummeted: Oil down 11.3%, Gold down 1.4% and the broad CRB Index down 5,3%.

That’s it for this month’s Market Comments, stay tuned, markets never skip a beat.


Past performance is not indicative of future results. The views, strategies and financial instruments described in this document may not be suitable for all investors. Opinions expressed are current opinions as of date(s) appearing in this material only. References to market or composite indices, benchmarks or other measures of relative market performance over a specified period of time are provided for your information only. NS PARTNERS SA provides no warranty and makes no representation of any kind whatsoever regarding the accuracy and completeness of any data, including financial market data or other financial instruments referred to in this general comment. This document does not constitute an offer or solicitation to any person in any jurisdiction in which such offer or solicitation is not authorized or to any person to whom it would be unlawful to make such offer or solicitation. Any reference in this document to specific securities and issuers are for illustrative purposes only, and should not be interpreted as recommendations to purchase or sell those securities. References in this document to investment funds that have not been registered with the FINMA cannot be distributed in or from Switzerland except to certain categories of eligible investors. Some of the entities of the NS Partners Group or its clients may hold a position in the financial instruments of any issuer discussed herein, or act as advisor to any such issuer. Additional information is available on request. © NS Partners Group

The domino effect

The domino effect

Surging inflation is triggering chain reactions. Only one thing is sure: this will be a hot summer

In March 2022, we headlined one of our articles “The only thing certain is uncertainty”. Three months later, this headline seems timelier than ever. In fact, in reaction to galloping inflation and growing political pressures, central banks in developed economies have begun to raise rates. While they have so far done so moderately, this nonetheless mark a return to conventional monetary policies with the end of quantitative easing, except in China, and, hence, less liquidity on the market.

This might have hit market valuations less hard if it wasn’t happening amidst a pronounced slowdown in economic growth. As a result, the spectre of stagflation is very much haunting the global economy, as is readily apparent on the markets.

Investor nervousness is showing up in high volatility

Let’s take the example of VIX, the index that reflects implied volatility in US equities. Despite the robust market rally over the past two years, VIX has never pulled back to its pre-Covid levels. This points to heightened investor stress. In terms of performance, with the exception of two steep monthly drops in April and June, the other months have been almost flat, but only after a steep run-up in volatility during the month. May is a good illustration of this, as the S&P 500 ended the month up by 1 basis point after being down by as much as 11.5% during the month. A real rollercoaster ride!

Tech giants have clay feet

It was the investor darling for a decade, but the US tech index, the Nasdaq, is now down by more than 30% on the year to date. Looking more closely, we see that some tech segments, such as those represented in ARK Innovation, a now-infamous ETF, are closely replicating the bursting of the Internet bubble of the early 2000s.

Now spreading to all asset classes

And it’s not just the equity markets that are falling. Since May, corporate bonds have also been under attack, with spreads widening sharply and in all market segments. Not to mention cryptos, which are suffering massive deleveraging. In a way, they are experiencing not their Warholian 15 minutes of fame, but, rather, their “Lehman” moment, with some cryptocurrencies crashing, some market participants defaulting, and some initial broker bankruptcies.

Earnings releases will drive the trend

So, what to make of the markets in the first half of 2022? And, more to the point, what will they do in the coming months? We will find out a little more during quarterly earnings releases, which begin next week and will set the tone for the rest of the year. Some companies will probably announce lower figures and narrower margins, but the real question will be: by how much and in which sectors?

Selectiveness is the watchword

Counterintuitively, the correlation between sectors and individual stocks has recently risen significantly compared to six to nine months ago. As a result, equity investors thinking about shifting back to a risk-on stance by buying stocks that have become attractively priced by historical standards should be even more selective than usual. That being said, it is clear that most long/short managers are still very defensive at this point, with historically low market exposure. The only glints of hope are from China, where equity markets appear to have bottomed out recently with the backing of the monetary authorities.

Don’t go outside this summer without your umbrella

Market euphoria has not traditionally been a hallmark of the summer period. August, in particular, is usually marked by a certain listlessness. But even if the markets are quiet at times, there will mostly likely be some jerkiness. With this in mind, cautiousness is the byword. Holding on to some cash therefore makes sense, as does active management with a focus on traders, who are able to generate quick returns and whose use of options gives them positive convexity.

To sum up, the current state of the financial markets reminds us that investment is still the business of professionals and that when your taxi driver starts talking up cryptocurrencies, it is not necessarily a buying signal. Keep that in mind!

Chart of the Month – Nowhere to run, nowhere to hide

Chart of the month – Nowhere to run, nowhere to hide

chart of the monthThose of you that have aged well will remember the Billboard Hot 100 single “Nowhere to Run” by Martha Reeves & The Vandellas which was released in 1965 by Motown and copied & remixed by many such as The Isley Brothers, Laura Nyro, Michael Bolton and The Commitments (for you younger folks out there). At the time the 60% equities / 40% bonds (“balanced”) portfolio had already been around for over 10 years, invented by Nobel prize winner Harry Markowitz. The classic 60/40 portfolio has delivered an annualized return of 4.54% over the last 28 years with a Sharpe of 0.44. Fast forward to today and the conventional model which has been so successful historically has suddenly been turned on its head and questioned as the benchmark index was down 14.4% YTD as of mid-May! This is the worst synchronized decline for equity and fixed income benchmarks in history. So, have hedge funds finally earned their place at the dinner table? Not the case this year for most of the successful equity long short names in the industry, irrespective of their geographical focus.
Exactly two years ago, we wrote a piece titled “Survival of the Fittest” which was to be the blueprint for the enhancement of our multi-strategy low volatility mandate which had been running for over 20 years. A year later we wrote the sequel “In Pursuit of Looking Sharpe” after having implemented the changes outlined in our blueprint by adding a number of multi-PM platforms to the portfolio. In summary, the success of the multi-PM model is predicated on their ability of imposing strict stop-loss guardrails in order to prevent drawdowns in addition to being the most efficient allocators of capital to differentiated sources of alpha. Furthermore, multi-PM platforms are increasingly working with external managers enabling them to outperform their peers and produce higher Sharpe ratios (in addition to avoiding high acquisition costs associated with the traditional turf wars between the larger funds). Fast forward to today and as they say “the proof is in the pudding” following two years of live track record in the enhanced mandate. And thus, we truly have an all-weather approach as an alternative to fixed income that enables you to sleep well at night without having to worry about the extreme intra-day moves we have been witnessing of late.

This month’s chart illustrates the sum of all the monthly drawdowns of the MSCI World Index over the last 2 years stacked up against the returns of our multi-strategy low volatility mandate during the same periods. So far, we are pleased with the live crash-test results with a spread of 33.75%, thus making it a viable “alternative” to traditional portfolios. This year Value, Growth and Momentum have been the biggest driver of single stock volatility (and unfortunately Quality has become correlated to Momentum recently) with many of the largest and most successful managers in the equity long / short space witnessing their largest drawdowns of their investment careers. In striking contrast, the equity long / short managers within the multi-PM platforms have been able to perform well due their factor awareness (if not factor neutrality in some cases) together with their low net market exposure.

Remember this famous quote: Crises take much longer to arrive than you believe and they happen much faster than you thought they could (the late Rudi Dornbusch – the economist who graduated from the University of Geneva)!


Past performance is not indicative of future results. The views, strategies and financial instruments described in this document may not be suitable for all investors. Opinions expressed are current opinions as of date(s) appearing in this material only. References to market or composite indices, benchmarks or other measures of relative market performance over a specified period of time are provided for your information only. NS Partners provides no warranty and makes no representation of any kind whatsoever regarding the accuracy and completeness of any data, including financial market data, quotes, research notes or other financial instrument referred to in this document. This document does not constitute an offer or solicitation to any person in any jurisdiction in which such offer or solicitation is not authorized or to any person to whom it would be unlawful to make such offer or solicitation. Any reference in this document to specific securities and issuers are for illustrative purposes only, and should not be interpreted as recommendations to purchase or sell those securities. References in this document to investment funds that have not been registered with the FINMA cannot be distributed in or from Switzerland except to certain categories of eligible investors. Some of the entities of the NS Partners Group or its clients may hold a position in the financial instruments of any issuer discussed herein, or act as advisor to any such issuer.  Additional information is available on request.

© NS Partners Group

Protected: NS Macro Outlook & Investment Opportunities

This content is password-protected. To view it, please enter the password below.

Protected: NS Macro Outlook & Investment Opportunities

This content is password-protected. To view it, please enter the password below.

Chart of the Month – Interest Rate vs Equity “Fear”: Two different worlds

Interest Rate vs Equity “Fear”: Two different worlds

Source JP Morgan

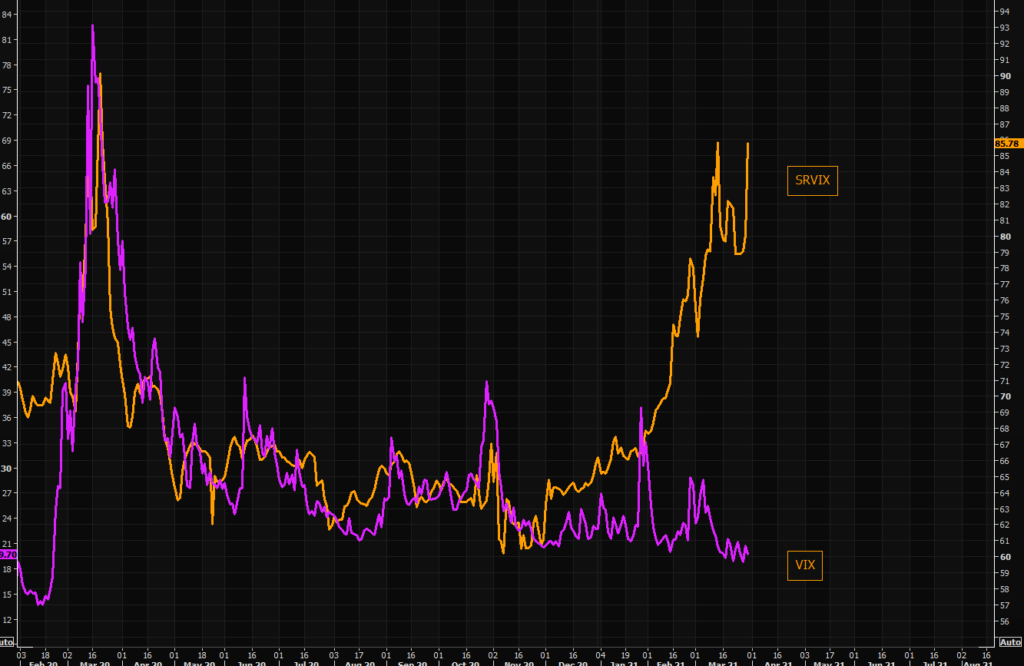
SRVIX vs VIX “gap” is once again getting very extreme.

The current gap has been mentioned during multiple conversations with HF managers recently. They also confirmed that equities are not realizing much volatility nor is much “exogenous” risk being priced in for now, as suspicious as it may sound….

The latest turbulence further to the implosion of Archegos is so far just an isolated event, but there is a general trend pushing risk managers to look through the portfolios and the average order book, simulating scenarios in a new way.

Yields have put in a “big shooting star candle”.

Will we get a pause in yields and rates vol?… Most believe that SRVIX vs VIX gap isn’t sustainable.


Past performance is not indicative of future results. The views, strategies and financial instruments described in this document may not be suitable for all investors. Opinions expressed are current opinions as of date(s) appearing in this material only.

References to market or composite indices, benchmarks or other measures of relative market performance over a specified period of time are provided for your information only. Notz, Stucki provides no warranty and makes no representation of any kind whatsoever regarding the accuracy and completeness of any data, including financial market data, quotes, research notes or other financial instrument referred to in this document.

This document does not constitute an offer or solicitation to any person in any jurisdiction in which such offer or solicitation is not authorized or to any person to whom it would be unlawful to make such offer or solicitation. Any reference in this document to specific securities and issuers are for illustrative purposes only, and should not be interpreted as recommendations to purchase or sell those securities. References in this document to investment funds that have not been registered with the FINMA cannot be distributed in or from Switzerland except to certain categories of eligible investors. Some of the entities of the Notz Stucki Group or its clients may hold a position in the financial instruments of any issuer discussed herein, or act as advisor to any such issuer.

 Additional information is available on request.

© Notz Stucki Group

Chart of the Month: Where is the truth?

Chart of the Month – Where is the truth?


Source: Bloomberg 31-Aug-2016

Regulators on both sides of the Atlantic agreed to introduce Contingent Convertible bonds (“CoCos”) following the big financial crisis as a way to strengthen banks’ capital levels and transfer the risk of a bank failing from governments to bondholders, thus preventing taxpayer bailouts. CoCos are securities issued by banks that will absorb losses by automatically converting to equity when the capital of the issuing bank falls below a certain pre-specified level (trigger event), hence building a loss-absorbing financial cushions during periods of financial stress. Since 2009, banks have issued about $380 billion of CoCos, of which $120 billion by European banks; to date, no CoCo has missed a coupon payment or experienced a trigger event.

However, CoCos hit the headlines with the market turmoil at the beginning of the year as debt sold by Europe’s biggest issuers tumbled on concern struggling lenders – including Deutsche Bank – might have trouble making interest payments. Concerns over the real intrinsic risk of these securities were raised by many investors.

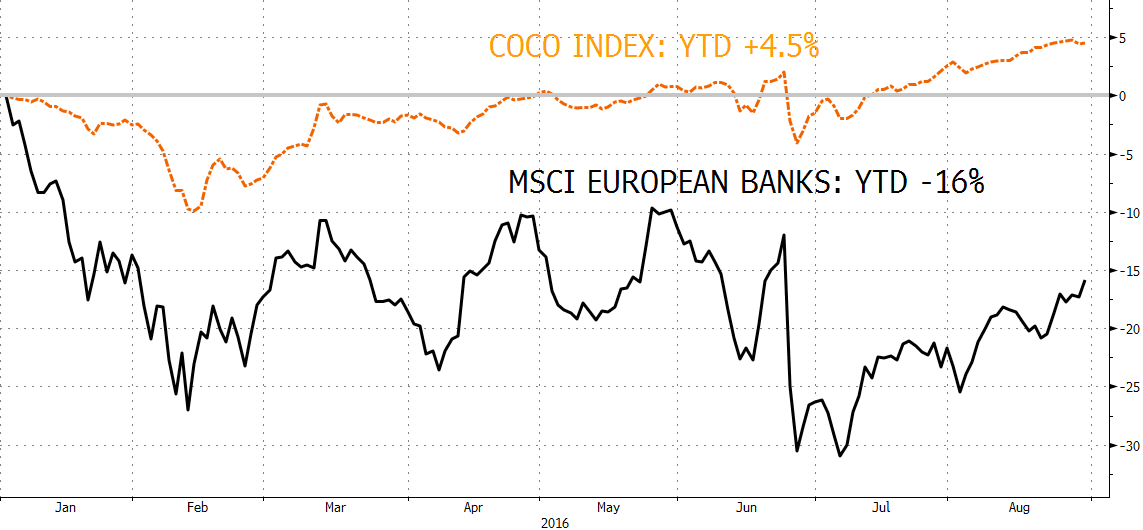
This month’s chart shows the performance of European banking sector versus the CoCo Index so far this year. Bank’s equities are trading at -16%, including a 15% recovery following the Brexit vote. On the opposite side, CoCos have fully recovered from the February loss and are up 4.5% year to date.

Therefore the question is: where is the truth? Is the CoCos’ recovery a consequence of investors’ search for yield at any cost and are now overpriced, or is the banks’ equity undervalued, offering an attractive entry level?

Unfortunately the answer is not unique since the divergence in performance of bank’s equity and CoCo has been driven by different factors. On the equity side, the explanation relies on the current ultra-low rates environment and negative interest policies (i), whereas the recent regulatory developments (ii) as well as the result of the last ECB stress tests (iii) have reassured investors about these bonds and the banks’ capital level.

  1. EU bank revenues continue to come under pressure as rates stay and are expected to remain low following the economic uncertainties triggered by the UK’s Brexit vote, leading to further expected reduction in banks’ net interest income. Furthermore, while the introduction of zero policy rates appears to have had a positive impact on credit creation, there is no evidence that negative policy rates helped credit creation in Denmark and Switzerland.
  2. The steep sell-off of CoCos in the first quarter was provoked by confusion over when exactly diminishing levels of capital would require a lender to halt coupon payments. Since then, regulators have sought to reduce uncertainty:
    • First, the ECB agreed to include a portion of Pillar 2 in the CBR (“combined buffer requirement”, a measure of the total Common Equity Tier 1 capital), resulting in increased protection for investors from coupon deferrals;
    • Second, the European Commission has proposed boosting protections for holders of CoCos, allowing banks to pay stock dividends and bonuses to employees only if coupons are paid in full. The coupon-protection plan is currently under study at the ECB.
  3. Finally, the last ECB’s stress test highlights that EU main banks have built up a substantial amount of capital since the financial crisis and are considerably more stable than at the time of the last stress test in 2014. Indeed, an average Capital Tier 1 ratio of 13.2% provides a significant buffer against the adverse scenario stress test assumptions (which include a recession, weak domestic demand, declining property prices and widening of sovereign credit spreads, among others

As a result of the ECB and European Commission interventions, CoCos have experienced a nice and gradual recovery that might continue going forward. For comparison, the CoCo Index is priced with an spread to worst of 443bp with an average rating of BB1, compared to a less attractive European High Yield Index’s spread of 395bp with an average rating two notches lower (BB3). As a practical example, Rabobank 5.5% 01/22/2049 (BBB-, Common Equity Tier 1 at 13.5% and trigger event at 5.13%) is trading with a yield of 5% if called in June 2016 and almost 6% if not called; with the same rating, Repsol 3.63% 10/07/2021 is yielding 0.45%!

Concerns about the European banks’ ability to generate profits will continue to weight on the bank’s stocks as well as the potential, unintended consequences of negative rates policies. On the other side, the willingness of regulators to move forward in the definition of the rules and mechanism of CoCos will support the investors’ appetite for juicy yields.