Notz Stucki has just released its investment outlook for the last quarter of 2017.
Contrary to predictions at the start of the year, when it was expected that they would have to contend with rising interest rates, markets have been strong this year. Moreover one of the main hopes on President Trump’s election was that he would cut taxes and introduce a one billion dollar infrastructure plan. Not only has a clear tax policy not been set out by his Administration, but little else of any significance has been achieved so far, and the White House has suffered a dismaying series of shambolic incidents.
Evidence mounts that Mr Trump lacks the skills to run the executive arm of government, which is all the more disturbing given the bellicose situation in North Korea. However markets have risen against a background of steady economic growth and continued low interest rates. What the rise in the indices masks though is what a narrow market it has been. It has been a market driven by passive flows, with more and more money being run by ETFs. Any change to either the low interest rate environment or the cult of ETFs would have profound implications for investors.
Further evidence of the desperate hunt for yield was revealed in the last quarter.
Please click here to download the entire document.
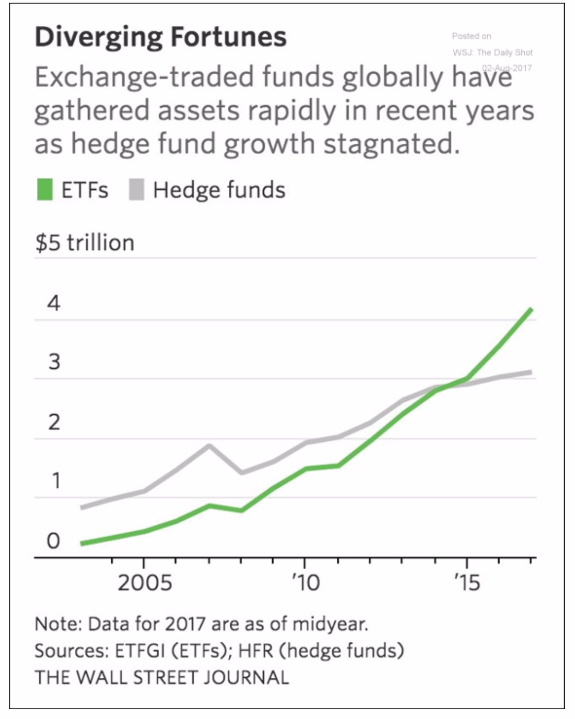
Chart of the Month – The rise of passives
The rise of passives
How the role of ETFs has evolved in an increasingly efficient market
Not a month goes by without an article in the press criticizing the high fee structures of both hedge funds and traditional long only funds and their underperformance in comparison to their benchmark indices. It comes as no surprise that ETFs have surpassed hedge funds in terms of total assets under management since the end of 2015 as they have become increasingly competitive in terms of pricing.
The rise in passive investing has clearly made active management more challenging, particularly in a rising market, which we have had since March 2009 (the second greatest bull market in modern history). To illustrate this, there have been numerous studies produced by the likes of S&P Global highlighting the fact that over 70% of equity managers underperform their benchmark net of fees over 10 years. The record is far worse for investment grade bond fund managers. With an increasing number of competitors within the investment community chasing the same opportunities (particularly in the US) it has become increasingly challenging to generate Alpha. Violent sector rotations have also become increasingly prevalent in equity markets creating significant challenges for active managers. Where passives may run into trouble is during sideway markets and is when active managers should be able to outperform.
During the past decade, it is estimated by JP Morgan that passives and quants have increased their share of equity trading volumes from less than 30% to around 60% dwarfing the volumes originating from fundamental discretionary managers. This partly explains the low levels of stock dispersion and high levels of correlations between stocks which makes it very challenging for active managers to outperform. In addition, it is becoming more difficult for active managers to compete against passive managers in terms of operating expenses not to mention the cost of regulation and technology. The low cost model no matter what the industry, is based on generating volumes and passives are no exception with the market leaders cutting fees with the goal of increasing their value proposition. Although they may continue to gain market share from active managers as investors realize the fact that many of their active managers underperform in the long run one should wonder what would occur if global markets had a massive pullback following a bull market that has 101 months in the making (the tech bubble that ended in March 2000 lasted 113 months!). The inevitable question arises as to who will be on the other side of the trade as there is bound to be an overshoot to the downside when everyone sells on panic mode. Together with trend following CTAs and the more fashionable cocktail of risk premia strategies out there which will tend to sell equities in a market downfall the wakeup call could be deadly. ETFs have clearly become more complex over the years and given the low levels in the VIX, leverage has increased in the aforementioned range of products. They have also become very creative; there is an ETF that is based on the inverse performance of the VIX which was up over 100% YTD (to the first week of August) and in the top 30 of the most traded securities. Creativity has no limits but could also be an accident waiting to happen!
Investment Outlook Q3 2017
Notz Stucki has just released its investment outlook for the third quarter of 2017.
“The reduction of interest rates below their natural levels has poisoned the river at its source, and nobody knows whether the water is fit to drink.” Jonathan Ruffer
The markets performed well in the second quarter propelled by the reassuring election result in France which drew a line under the populist victories in the major elections last year.
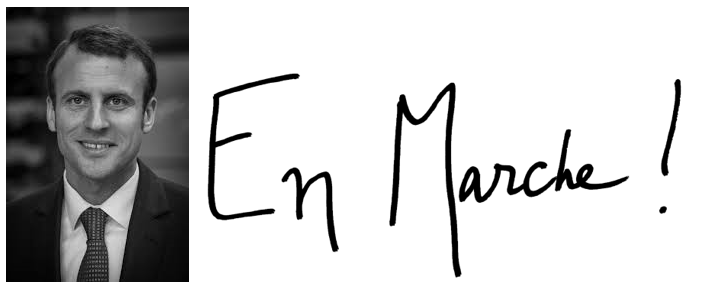
Emmanuel Macron, 25th President of the French Republic
As the year has progressed the shocks of Brexit and the Trump victory have been digested, and there is more clarity on what they may signify. Ironically after four decades of being a difficult member of the EU Britain may become a better European state when it leaves, being forced to accept compromises. The Brexit negotiations are likely to offer more noise than light in the next year, the process has been likened to negotiating a divorce with 27 spouses simultaneously, but despite the nationalist rhetoric both sides are incentivised to come to a sensible agreement, and Mrs May’s disastrous election campaign has weakened the hand of the hard Brexit camp. Meanwhile the more one watches the Trump administration the more it seems that the Barbarians are in the Castle. Mr Trump’s unpredictability and lack of Washington experience has affected his ability to push his reforms through. Thus far the anglo-saxon world has seemed powerless to translate the visceral voter anger into legislation.
As politics becomes less of a concern investors can worry again about QE-fattened markets…
Please click here to download the entire document.
Portfolio managers beware: factor based ETFs and how they can be helpful
Breaking down your broad universe of food groups into their more basic elements and nutrients is now part of our daily habits. Checking labels for sugar, fat, carbs and protein content isn’t just the remit of Californian health freaks but something that is part of every shopper’s habit nowadays. Although worlds apart from a chef preparing a meal in a restaurant, most asset managers will look at factors in exactly the same way we look at key ingredients: factors are to assets what nutrients are to food – both cream and pork bellies contain protein and fat, just as economic risk is present in public equities, private equity, high yield and hedge funds. Understanding portfolio drivers or risk and return through factor analysis isn’t much different from understanding how food groups react with each other under hot and cold conditions to produce the perfect meal. Following the path of the food industry, the disaggregation of investment returns which began with the CAPM in the 60s and advanced by the Fama-French three factor analysis in the 90’s has now moved from theory to the real world.
Many active managers have therefore used factor based models quite extensively with the building blocks of their factor analysis revolving mainly (for equity managers anyway) around value, small caps, low volatility, high yield, quality and momentum. A few years back when I worked for a large Swiss group, risk management would sit down with PMs and look at their portfolio based on the factors above as well as sensitivity to rates, oil and other more macro elements. If the PM claimed his or her main source of return was based on fundamental work and stock picking, the factor chart would have to reflect that, essentially showing very little exposure to any given one. If the factor study showed strong correlation to one or two factors, then performance (and risk) was driven by something outside their remit and we were confronted with a binary choice: either accept we’re paying fees for something that was a static bet (more often than not coming from the PMs style) or simply redeem. There was very little else we could do.
‘Today there’s a wide range of factors through smart beta ETFs that are available to investors which give a new range of options’ states Angel Sanz, Notz Stucki’s Chief Economist who analyses manager talent (or lack thereof) on a daily basis for the firm. ‘When a team comes by our office to see us, first thing I’ll do is look at regressing their performance on my Bloomberg terminal against several factors and try to understand what types of exposure they’re offering on a factorial basis. If they’re unaware of how their return stream looks through a factor model or can’t address the differences between their portfolio’s characteristics and those of the closest factor index, it will make for a very short meeting. In the past, I may still have invested’ opines Sanz ‘if I felt this type of factor exposure made sense (i.e. I was underexposed to this factor) even though I felt fees were egregious for something that didn’t require much talent. Today though, why would we want to pay fees to an active manager when ETFs are readily available that can give me the same kind of exposure?’
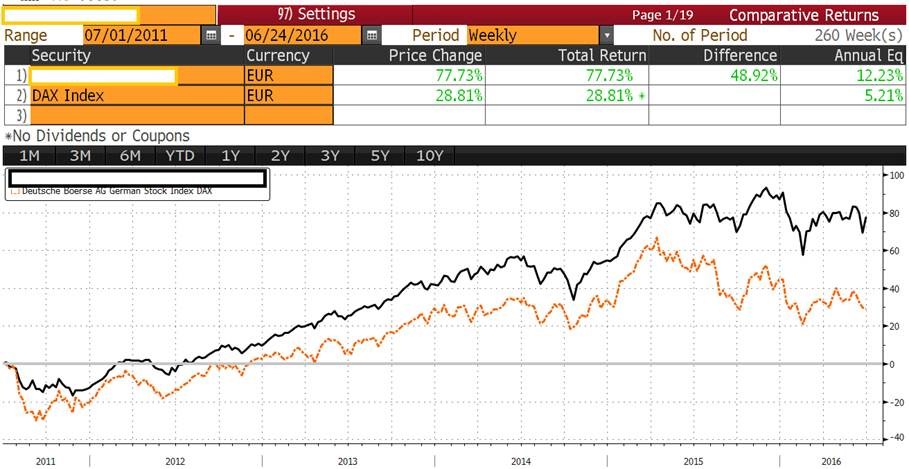
Graph 1 performance of actively managed German equities Fund vs its index
Graph 1 above looks compelling right? At first glance, this manager investing in German equities (black line) looks like they’re adding quite a bit of value (or alpha) vs the DAX (yellow line).
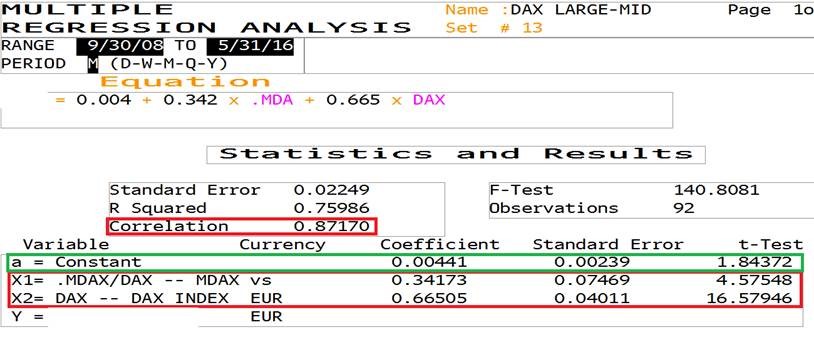
Table 2 linear regression of the fund vs German equity risk premia
But a closer look at a regression analysis on Bloomberg, trying to explain his or her returns shows a different picture. In table 2, it becomes clear that almost 100% of the performance can be explained by 2 factors, the DAX and the MDAX (the German mid cap index). The constant or alpha is low and not even statistically significant (i.e. t-test below 2)… a different proposition altogether.
To get back to basics, an active manager’s return in excess of the benchmark can be broken down into three components (1) returns to static factor premia, such as tilt to value or momentum stocks (2) manager skill coming from factor timing and (3) manager skill coming from security selection. Points 2 and 3 are the only things we’re willing to pay for and now we can do something about it.
It can also help assessing what kind of risks we have in our overall portfolio. Factor based studies also help us better understand, on a look through basis, what kind of risks we’re taking for our overall portfolio. Norges, the (very) large Norwegian wealth fund and government pension plan, were instrumental in addressing this. In late ’08, they were surprised at how their investments, which had supposed independent bets and offered adequate levels of diversification, all collapsed in tandem. It was their drive in trying to understand what they had exposed themselves to that led to this development, ultimately pushing most institutions to look at factors in a more granular way.
‘I’m looking to pay active managers who generate genuine alpha through either tactical timing around markets and factors or through security selection. Static factor tilts can be replicated more cost efficiently with smart beta strategies’ opines Sanz and goes on to conclude ‘the availability of smart beta ETFs helps me improve portfolio outcomes, reduce costs and more importantly increase performance transparency’.
Perception vs. Reality: are high yield ETFs riskier than similar funds?
Daniel Kahneman, the Nobel Prize in Economic Sciences in 2002, wrote a best-selling book entitled “Thinking, Fast and Slow”. The central thesis of the book is that human beings have two modes of thought: System 1: Fast, instinctive and emotional; System 2: Slow, deliberative and logical. We can say that System 1 resembles the PERCEPTION, whereas, System 2 is closer to the REALITY. Being so fast and so emotional, sometimes the PERCEPTIONS may distort or exaggerate the news delivered by the market, whereas REALITY gives the investor a medium-long term framework to better assess the market situation.
Discover our monthly series “Perception vs. Reality”!
PERCEPTION
The Financial Times published on 10-Dec-15 the following headline and paragraph:
“US regulator highlights ETF and junk debt risks. A US regulator has rebuffed concerns over the health of the US corporate bond market, but highlighted “emerging risks” in exchange traded funds and junk debt”
Many investors, authorities, and other market players have been vocal over their concerns regarding new types of risks stemming from the high growth ETF market, specifically in High Yield (HY) ETFs: “They are passive investments which will invest in liquid and illiquid bonds”; “In a bear market, retail investors will get scared and sell their HY ETF creating liquidity mismatching problems”; “High Yield ETFs will not be able to honored redemptions in a bear market” are typical sentences taken from the financial press in the last 6 months.
Investors have legitimate reasons to be vigilant. These are not the most liquid securities and as we remember too well, during the Great Recession of 2008-09, equity shares dropped 50%, convertible bonds could not be sold and US high yield bonds lost 32% (peak to through), mainly because of the illiquidity of those assets. Fool me twice, shame on me as the saying goes and the argument that strong liquidity risks may originate from the mismatch between instant liquidity promised by HY ETFs and the low liquidity of their underlying assets, is a compelling one.
REALITY
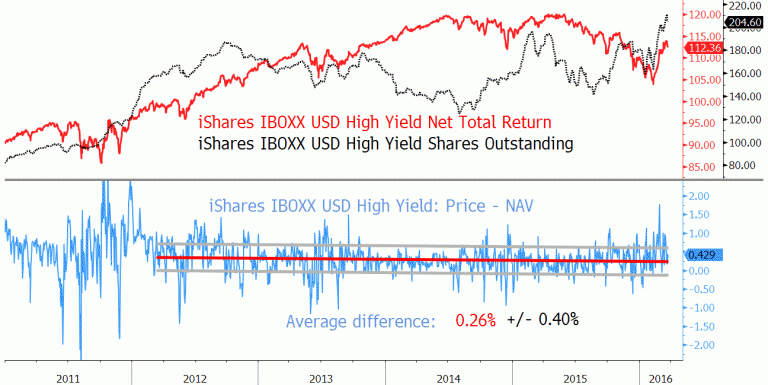
The red line in the top panel of the chart shows the performance (net of dividends) of the largest US HY ETF, iShares IBOXX USD HY which accounted for $15.5Bln as of 29 February‘16 out of the $48.2Bln of the total HY ETF market (1). The black line displays the total shares outstanding.
Source: Bloomberg & Notz Stucki
We can see how quickly investors reacted to bad news and, during the Jan-Feb bear market, redeemed about 11% of their investments in this ETF over 40 days (31 December ‘15 to 12 February‘16). These redemption volumes are more or less in line with what was happening during March-2015 to August-2015 or redemptions from June-2012 to June-2014. This is the first time after the summer of ’11 we’ve witnessed important selling in a falling HY market, the exact situation investors feared the most.
How did ETFs manage redemptions?
One way to measure it indirectly is by looking at the bottom panel that shows, in blue, the difference between the price of the ETF and the NAV. Whereas in the ‘11 bear market, the spread between price and NAV fluctuated often between +1% and -1%, the spreads in ‘12-‘16 have been tighter and moving in a band of -0.14% to 0.66% (-/+ one standard deviation), which we consider as perfectly acceptable. Interesting enough, after 12 February, investors turned around, and fearlessly started to buy shares. In fact today, the ETF has the highest level of assets in its history. With the benefit of several years’ experience, ETF managers have somehow learned how to better manage redemptions (the blue line tells the story).
Why could they handle redemptions “so well” contrary to expectations?
Let’s look at simple figures:
Total USD High Yield assets (domestic and international issuers): $1.8 tr. (JP Morgan)
Total USD High Yield assets managed by ETFs: $48.2 bn. (Blackrock)
Ratio ETFs / Total market: 2.6%
Even though investors may be faster to pull out money from ETFs, it does not seem to be much of an important risk for the market when they account for as little as 2.6% of the total assets.
CONCLUSION
HY ETFs have liquidity mismatches, but these are very similar to the investment funds invested in HY which offer daily liquidity. ETF managers have improved the techniques to handle redemptions vs. what happened in 2011. The relative size of HY ETFs vs industry is very small and needn’t be cause for much concern.
Be that as it may, this piece’s main purpose is to simply play down the risks associated with HY ETFs. When looking exclusively at performance, the largest active US mutual fund managers have done better than their passive counterparts as they avoided the bad components of the index…but this is a point best made another time.
(1) Doing the same analysis with the second largest HY ETF, SPDR Barclays High Yield, with $10.3 bn. assets draws similar conclusions.