June General Market Comments

June General Market Comments

« Driver’s Seat » – Sniff ‘n’ the Tears, 1978

AI, Big Tech and consequently the Nasdaq are in the driver’s seat in 2023. They’ve set the pace for what is, so far, a very good year for global equity markets, notwithstanding the immense performance gap between sectors and styles: to wit, the MSCI World Growth is up 26.5% at the end of June, versus only +2.5% for the MSCI World Value.

June 2023 saw, from the middle of the month, some kind of marginal rebalancing: upside participation has been a tad broader than previously this year, which is healthy (the S&P 500 and the Nasdaq ended up the month with almost exactly the same performance, slightly below +6.5%). This is also logical because interest rates were not supportive of expanding valuations last month: the US and German 10 year yields respectively rose 19 and 11 bps.

In the meantime, Credit was up again (+2% for the Itraxx Crossover in June, +7.6% year to date), Gold lost ground (-2.2%) as well as the dollar versus the euro. Currency markets have also shown some large moves this year, as the euro is up 1.9% versus the dollar, but the most impressive is the Japanese Yen fall (-10.1%) and, to a lesser extent, the Chinese Renminbi (-5.2%). The spectacular 21% upside in the Topix finally “only” translates into a +10% return year to date in USD.

Markets seems to tell us that the Fed will succeed in engineering a soft landing in the US, especially if upside participation broadens; markets often lead fundamentals, so this should be viewed as good news. What remains unclear is the capacity for valuations, and in particular for the most hype sectors, to stay at these levels.

That’s it for this month’s Market Comments, stay tuned, markets never skip a beat.


Past performance is not indicative of future results. The views, strategies and financial instruments described in this document may not be suitable for all investors. Opinions expressed are current opinions as of date(s) appearing in this material only. References to market or composite indices, benchmarks or other measures of relative market performance over a specified period of time are provided for your information only. NS PARTNERS SA provides no warranty and makes no representation of any kind whatsoever regarding the accuracy and completeness of any data, including financial market data or other financial instruments referred to in this general comment. This document does not constitute an offer or solicitation to any person in any jurisdiction in which such offer or solicitation is not authorized or to any person to whom it would be unlawful to make such offer or solicitation. Any reference in this document to specific securities and issuers are for illustrative purposes only, and should not be interpreted as recommendations to purchase or sell those securities. References in this document to investment funds that have not been registered with the FINMA cannot be distributed in or from Switzerland except to certain categories of eligible investors. Some of the entities of the NS Partners Group or its clients may hold a position in the financial instruments of any issuer discussed herein, or act as advisor to any such issuer. Additional information is available on request. © NS Partners Group

May General Market Comments

May General Market Comments

“Steamy Windows”, 1989 – A tribute to the legendary and immortal Tina Turner.

Trying to decipher the messages sent by economies and markets feels like trying to guess what lies behind steamy windows; you have an idea, but it’s not precise. Not more than 1 year ago, consensus was that a recession was inevitable in Europe and highly likely in the US, whereas it’s far less certain today; meanwhile, if not done yet, the Fed seems close to end its hiking cycle. China reopening should have triggered a massive boom for its equity market and commodities, but it hasn’t. Debt ceiling fuzz saw the dollar rise while the last minute deal, avoiding a default, has been followed by dollar weakness. Beyond an unclear short term horizon, two gigantic long term investment cycles still prevail: Digitalization and Cleaner Energy.
The crazy hype around AI and Nvidia shouldn’t make us lose sight of the fact that there will be profound consequences in terms of productivity with the widespread use of AI.
May 2023 was one of these very complicated months for equity investors who, if they were not exposed to the happy few rising stocks, had good reasons to be frustrated; the S&P 500 was almost flat, but it would have significantly been down without the contribution from mega-IT components who, besides the S&P, propelled the Nasdaq 100 7.6% higher. The absence of IT behemoths has cruelly been felt by Europe and Emerging Markets (down 3.2% and 1.9%), while Japan rose (+3.6%) with a weak JPY. Growth unsurprisingly humiliated Value (+2.3% vs -5.0%), while the strength of the dollar weighed on the MSCI World, which ended up the month down 1.3%.
Fixed-income was mixed: US 10 year yield rose 22 bps, Germany was stable and Italy, a good gauge of risk aversion, saw its 10 year benchmark yield fall by 9 bps. Credit enjoyed another very good month (+0.7% for the Itraxx Crossover), while all commodities plummeted: Oil down 11.3%, Gold down 1.4% and the broad CRB Index down 5,3%.

That’s it for this month’s Market Comments, stay tuned, markets never skip a beat.


Past performance is not indicative of future results. The views, strategies and financial instruments described in this document may not be suitable for all investors. Opinions expressed are current opinions as of date(s) appearing in this material only. References to market or composite indices, benchmarks or other measures of relative market performance over a specified period of time are provided for your information only. NS PARTNERS SA provides no warranty and makes no representation of any kind whatsoever regarding the accuracy and completeness of any data, including financial market data or other financial instruments referred to in this general comment. This document does not constitute an offer or solicitation to any person in any jurisdiction in which such offer or solicitation is not authorized or to any person to whom it would be unlawful to make such offer or solicitation. Any reference in this document to specific securities and issuers are for illustrative purposes only, and should not be interpreted as recommendations to purchase or sell those securities. References in this document to investment funds that have not been registered with the FINMA cannot be distributed in or from Switzerland except to certain categories of eligible investors. Some of the entities of the NS Partners Group or its clients may hold a position in the financial instruments of any issuer discussed herein, or act as advisor to any such issuer. Additional information is available on request. © NS Partners Group
La finanza e il cambiamento climatico

La finanza e il cambiamento climatico

Il clima sta cambiando e si verificano con frequenza sempre maggiore fenomeni meteorologici estremi, come alluvioni o lunghi periodi di siccità. Questi eventi condizionano profondamente l’economia e il benessere dei cittadini, con ricadute dirette anche in ambito finanziario. Infatti, un’economia cresce nel lungo periodo se a crescere è la produttività. Quest’ultima aumenta i redditi, quindi la domanda e l’offerta. Se l’economia cresce, e il suo PIL aumenta, a giovarne sono anche gli asset finanziari, in particolare il mercato azionario. Gli analisti stimano che gli effetti del cambiamento climatico ridurranno tra l’11% e il 14% la produzione economica globale entro il 2050 rispetto ai livelli di crescita senza cambiamenti climatici. Ciò equivale a ben $23.000 miliardi di riduzione della produzione economica globale annua.

Grado di vulnerabilità al cambiamento climatico nel mondo

Ma perché esiste un legame tra cambiamento climatico e prezzi azionari? In primo luogo, lo “stravolgimento” del clima, determina un incremento della volatilità degli eventi atmosferici: diventerà sempre più difficile prevedere il comportamento del clima. Tra i settori che potrebbero essere più influenzati si trova quello alimentare. Agricoltura e allevamento, e tutti i mercati collegati, potrebbero ridurre la produzione: siccità prolungate distruggono raccolti, risorse idriche e tutto si estende all’intera economia e al consumatore finale. L’offerta potrebbe quindi diminuire e di conseguenza i prezzi delle azioni di tale settore potrebbero ridursi. Ad esempio, chi produce i semiconduttori fa un abbondante uso di acqua per pulire i wafer di silicio che vengono installati in ogni dispositivo elettronico. Pochi anni fa, una profonda siccità ha colpito il Taiwan, sede di TSMC (la più grande società di semiconduttori al mondo) e isola che detiene il 92% della capacità produttiva di semiconduttori, costringendola a ridurre in parte la produzione. Un altro settore che potrebbe osservare un corposo aumento dei costi è quello assicurativo. Eventi meteorologici estremi pesano ovviamente molto sui profitti delle compagnie assicurative. In conclusione, per un investitore è quindi fondamentale considerare nelle proprie scelte di investimento i rischi e gli scenari legati al cambiamento del clima. Diversificazione e visione di lungo termine sono essenziali per migliorare i propri investimenti in un mondo che cambia velocemente.

Fonti: investing.com, Reuters.com, Skytg24

Di seguito l’ultima nota settimanale del nostro ufficio di Milano.

Nota settimanale 13.01.2023

  1. Panoramica macro
  2. La finanza e il cambiamento climatico
  3. I bear market e la FED


Disclaimer

Le performance passate non sono in nessun caso indicative per i futuri risultati. Le opinioni, le strategie ed i prodotti finanziari descritti in questo documento possono non essere idonei per tutti gli investitori. I giudizi espressi sono valutazioni correnti relative solamente alla data che appare sul documento. Questo documento non costituisce in alcun modo una offerta o una sollecitazione all’investimento in nessuna giurisdizione in cui tale offerta e/o sollecitazione non sia autorizzata né per nessun individuo per cui sarebbe ritenuta illegale. Qualsiasi riferimento contenuto in questo documento a prodotti finanziari e/o emittenti è puramente a fini illustrativi, ed in nessun caso deve essere interpretato come una raccomandazione di acquisto o vendita di tali prodotti. I riferimenti a fondi di investimento contenuti nel presente documento sono relativi a fondi che possono non essere stati autorizzati dalla Finma e perciò possono non essere distribuibili in o dalla svizzera, ad eccezione di alcune precise categorie di investitori qualificati. Alcune delle entità facenti parte del gruppo NS Partners o i suoi clienti possono detenere una posizione negli strumenti finanziari o con gli emittenti discussi nel presente documento, o ancora agire come advisor per qualsiasi degli emittenti stessi. I riferimenti a mercati, indici, benchmark, cosi come a qualsiasi altra misura relativa alla performance di mercato su uno specifico periodo di riferimento, sono forniti esclusivamente a titolo informativo.  Il contenuto di questo documento è diretto ai soli investitori professionali come definiti ai sensi della direttiva Mifid, quali banche, imprese di investimento, altri istituti finanziari autorizzati o regolamentati, imprese di assicurazione, organismi di investimento collettivo e società di gestione di tali fondi, i negoziatori per conto proprio di merci e strumenti derivati su merci, soggetti che svolgono esclusivamente la negoziazione per conto proprio su mercati di strumenti finanziari e che aderiscono indirettamente al servizio di liquidazione, nonché al sistema di compensazione e garanzia; altri investitori istituzionali, agenti di cambio e non è da intendersi per l’uso di investitori al dettaglio. Accettando questi termini e condizioni, l’utilizzatore conferma e comprende che sta agendo come investitore professionale o suo rappresentante e non come investitore al dettaglio. Informazioni aggiuntive disponibili su richiesta

© NS Partners Group

August General Market Comments

August General Market Comments

« You gimme fever, and a cold sweat » – James Brown, 1970

Like in the 70s, markets are giving us cold sweats on a regular basis since the beginning of the year. And fever sometimes, when they rebound sharply. August was a perfect illustration: after a red-hot July (+7.9%), the MSCI World roared until mid-month, adding more than 3.7% at some point, but miserably tanked thereafter to close the month with a -4.3% return.

Forget about what’s happening on the ground in Ukraine: it’s all about politics, from Governments and Central Banks. The politics of Energy, with Russia clearly willing to clamp down gas supplies to Europe and the panic this triggers on Electricity prices; the politics of Trade, with the US putting more and more limits for US corporations to deal with China when it comes to sensitive stuff (semiconductors for example); the politics of Climate, with countries all around the world thriving to reduce their carbon emissions; and, perhaps more importantly, the politics of Central Banks, with the Fed deliberately freaking out investors by announcing pain down the road, as its monetary policy will be tougher for longer.

A relatively pleasant earnings season has vanished very quickly in people’s minds, the focus being now on the consequences of Jerome Powell’s stubbornness. Soft landing? Soft recession? Deep recession? The worst situation for markets in general is when there are big uncertainties; among these, the first and foremost is the magnitude of the hiking cycle by the Fed: when will they stop, and at what level?

All this is too much for markets to stand still. The second half of August was painful, to say the least, and all major assets were down at the end of the month: as mentioned, the MSCI World lost 4.3%, more or less like the S&P 500 (-4.2%), the MSCI Europe was down 5.2%, World Value 3.3%, World Growth 5.4%. The Japanese Topix rose 1.2%, but the Yen tumbled a further 4.1% versus the USD, and is down a whopping 20.5% this year!

No respite on Government bonds, as the US 10 year rose 54 bps and the 10 year Bund 72 bps, while credit weakened again: the Itraxx Crossover fell 2.6%. Gold lost 3.1%, Oil suffered its worst drawdown this year with the WTI down 9.2%.

That’s it for this month’s Market Comments, stay tuned, markets never skip a beat.


Past performance is not indicative of future results. The views, strategies and financial instruments described in this document may not be suitable for all investors. Opinions expressed are current opinions as of date(s) appearing in this material only. References to market or composite indices, benchmarks or other measures of relative market performance over a specified period of time are provided for your information only. NS PARTNERS SA provides no warranty and makes no representation of any kind whatsoever regarding the accuracy and completeness of any data, including financial market data or other financial instruments referred to in this general comment. This document does not constitute an offer or solicitation to any person in any jurisdiction in which such offer or solicitation is not authorized or to any person to whom it would be unlawful to make such offer or solicitation. Any reference in this document to specific securities and issuers are for illustrative purposes only, and should not be interpreted as recommendations to purchase or sell those securities. References in this document to investment funds that have not been registered with the FINMA cannot be distributed in or from Switzerland except to certain categories of eligible investors. Some of the entities of the NS Partners Group or its clients may hold a position in the financial instruments of any issuer discussed herein, or act as advisor to any such issuer. Additional information is available on request. © NS Partners Group

Chart of the Summer – When the FED tightens, there is (almost) no place to hide

When the FED tightens, there is (almost) no place to hide

So far, 2022 has been a tough year with many headwinds in capital markets: Russian invasion of Ukraine, new Covid cases in China bringing partial lockdowns, increasing energy and food prices, rising inflation, etc… but, if we had to just name one, we would say that the FED tightening process is the most consequential. The old sentence “Don’t fight the FED” has never been so true. During the last 4.5 months, the FED has increased its official rate from 0.25% in mid- March to 2.5%.

TRADITIONAL ASSET CLASSES:

  1. EQUITIES: High valuations, higher discount rates and lower expected economic growth have made equities lose USD19 trillion in 7 months to deliver a -12.9% High growth stocks with demanding valuations were the most vulnerable.
  2. BONDS: All bond prices have adjusted to the new reality after the FED hiked rates. Unfortunately, bonds and equities became highly correlated again and the world bond aggregate lost 6.7%, which is a very important loss for an asset class that is also known as “fixed” income.
  3. REFERENCE TRADITIONAL BENCHMARK: 60% EQUITIES + 40% BONDS: This popular reference index has lost 10.4% during the year.

Was there any hope in the alternative asset classes to compensate for the poor performance in the traditional portfolios? Not much:

  1. HEDGE FUNDS. We used the daily index, as the most common indexes are still not available as of 31 July. At least the -4.5% returns did not look that bad, although there were large differences between the more conservative ones (relative value, macro, arbitrage, etc) – which were slightly negative – and the long/short, who did not perform well, specially because they continued with a growth bias.
  2. PRIVATE EQUITY: Its returns are not available yet, so we took as proxy the Index with the listed private equity companies. As private equity is “somehow” a leveraged version of public equities, the proxy we are using posted a -22.0% Venture Capital suffered more than others with the fall of growth stocks.
  3. REAL ESTATE: Its returns are not available yet, so we took as proxy the FTSE EPRA Nareit Global REITS Net Tax in USD. Real Estate is obviously sensitive to interest rates also and this market took a hit of 13.7%.
  4. The only bright spot with a +35.3% performance. Interestingly, the energy subindex is the only one that was positive, as Agriculture, Industrial Metals and Precious Metals were flat or negative. Oil and Natural Gas were also going up before the Ukrainian conflict, and the invasion exacerbated the market.
  5. BITCOIN: The whole crypto market has gone from a USD 3 trillion market to about USD 1 trillion. Despite the different drivers of this market, it has finally become highly correlated with risky assets (Nasdaq) and has tumbled 48.6%.
  6. GOLD: Traditionally a good hedge against inflation, it has not been the case this year, although we may say that -3.5% is a decent performance compared to other assets performance.

Unfortunately, we have seen that only energy has produced positive returns this year, and the rest of the assets had negative or very negative returns. Investors still have 5 months to recover these losses, navigating in an environment that does not provide too much diversification.


Past performance is not indicative of future results. The views, strategies and financial instruments described in this document may not be suitable for all investors. Opinions expressed are current opinions as of date(s) appearing in this material only. References to market or composite indices, benchmarks or other measures of relative market performance over a specified period of time are provided for your information only. NS Partners provides no warranty and makes no representation of any kind whatsoever regarding the accuracy and completeness of any data, including financial market data, quotes, research notes or other financial instrument referred to in this document. This document does not constitute an offer or solicitation to any person in any jurisdiction in which such offer or solicitation is not authorized or to any person to whom it would be unlawful to make such offer or solicitation. Any reference in this document to specific securities and issuers are for illustrative purposes only, and should not be interpreted as recommendations to purchase or sell those securities. References in this document to investment funds that have not been registered with the FINMA cannot be distributed in or from Switzerland except to certain categories of eligible investors. Some of the entities of the NS Partners Group or its clients may hold a position in the financial instruments of any issuer discussed herein, or act as advisor to any such issuer.  Additional information is available on request.

© NS Partners Group
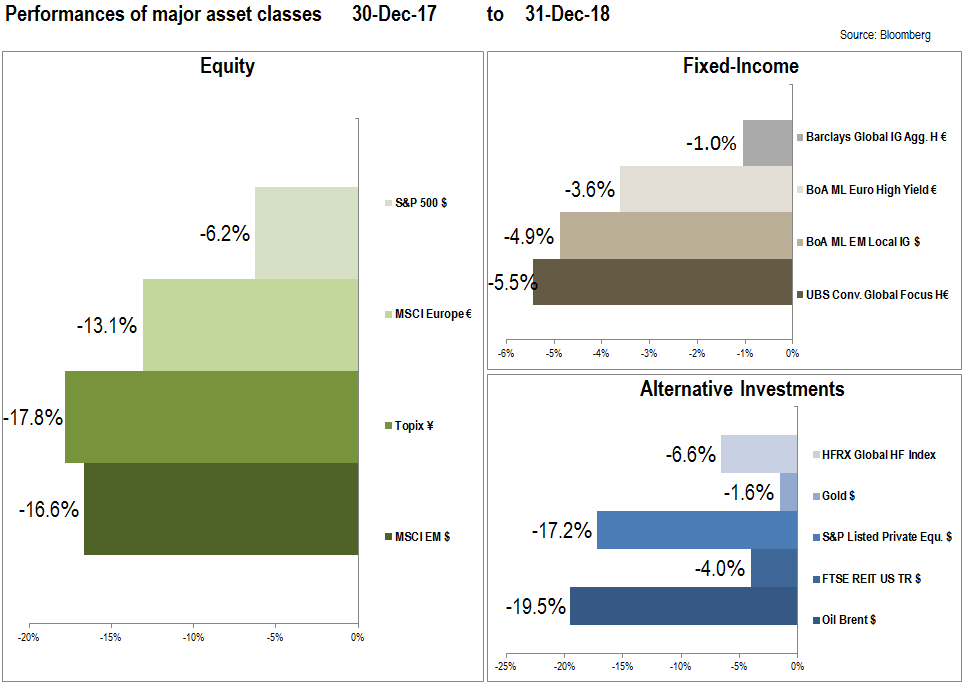
Chart of the Month – FED vs Growth for Emerging Markets

FED vs Growth for Emerging Markets

We are generally not fan of discussing EM as a single group as countries’ profiles and reaction functions are increasingly different from a country to another. But for the sake of simplification in this monthly chart we would assume so.

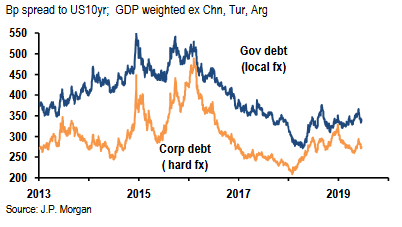
So which EM asset class would benefit most in the context of renewed global monetary easing? That would not only depend on short-term rates at the FED and the ECB. For EM currencies, as the FED move dovish, all major EM central banks are also expected to cut their policy rates. While the possible FED resumption of an easing cycle has recently pushed most EM currencies higher, the next leg up might take some time to materialise. The market might now wait for actual cut to materialise and growth to improve (including some sort of trade tensions resolution or truce between the US and China). The other ingredient needed to support EM currencies and local debt more generally, is inflation which in both the US and EM (collectively or individually) should stay contained.

For EM credit, a mild or even sluggish growth would be enough for the asset class to keep performing in the context of dovish central banks and contained inflation.

The real underperformer so far is EM equity and more specifically Asia Equity complex. In the case of EM equity, a higher inflation would be much better absorbed if growth rebounds and trade conflict is contained or resolved.

Investment Review Q4 2018

2018 was a brutal year for financial assets. A chart issued by Morgan Stanley shows all 17 major asset classes down for the year. Fixed income and equities in both Developed and Emerging Markets, and Commodities all fell. The indices disguise the true extent of the damage. The index heavy weights held up relatively well, while many smaller stocks were ravaged, but the year was epitomised by the 60% fall of General Electric, perhaps the most iconic company of the twentieth century. This performance was the more surprising as the US achieved strong economic growth and companies’ earnings growth were further boosted by the tax cut. It is unusual that equities decline when the US is doing well, or that bonds and equities decline together. The final quarter saw the stock market fall at its most intense. This seemed odd. If one had been told on 1st October that over the next three months the Federal Reserve would indicate a lower trajectory of interest rate rises, that the oil price would drop 40%, and that there would be less confrontational news on the US-China friction and the Italian budget stand-off, one would not have anticipated such a plunge. By year end the World Index had fallen 10.44%, while the US index fell 6.24%, of which 9.18% was in December alone, and China had fallen 24.59%. The yield on the US 10-year bond rose from 2.40% to 2.68% during the year. Bitcoin which was at the centre of speculation a year ago fell 75%.

What has caused this upheaval?

Please here to download the entire document.

Chart of the Month – 2018: No place to hide to make money. 2019: Typically, reversion.

2018: No place to hide to make money. 2019: Typically, reversion.

During 2018, all major asset classes delivered negative returns as can be seen above.

EQUITIES

2018: Starting valuations were very demanding. During the year, equity investors were scared by the coming slowdown (some even talk about recession), the US-China trade war, the FED tightening process, the Italian risk, etc.
2019: With valuations already attractive (SP500 PE12Month: 14.6x; MSCI Europe: 12.1x; Topix: 11.3x; EM: 10.6x), we may see the reversal of 2018, as we do not expect a recession but a slowdown in the world economy.

FIXED INCOME

2018: The high valuations at the beginning of the year, the tightening of the FED, the fear to a large economic slowdown, the problems in some emerging markets and the problems of the Italian economy (Italy is one of the largest issuer of bonds in the world) put all the fixed-income indexes in negative territory.
2019: Central banks will continue with the tightening process, so it is still uncertain what government bond bond indexes will do. Credit related assets look more attractive with spreads in the high yield space at around 5.0%, which are interesting with our view of a slowdown, but not a recession.

ALTERNATIVE INVESTMENTS

2018: Alternative investments were not the positive alternative to traditional assets. Hedge Funds and private equity are not able to weather the storm when all the markets are down. Gold did not hedge the portfolios as it does not perform well when rates hike. REITS were also negative in a rate hike environment. Oil was the worst performer with an unbalanced supply-demand, and geopolitics impacting the price in non-predictable ways.
2019: Hedge funds and private equity (more correlated with traditional assets) are likely to revert the losses of 2018. Difficult to predict what gold and REITS will do as monetary tightening is likely to continue. Oil prices have probably reached a bottom level.

CONCLUSION

2018 was the “annus horribilis” of the capital markets with no place to hide to make money. 2019 has started with attractive valuations and some challenges (US-China trade war, Brexit, Central banks tightening). If history is any guide, we may say that after such a bad year, the market delivers good returns the following one. Our view is that we are facing a slowdown in the economy, but markets are incorporating prices that reflect a dramatic slowdown close to a recession.

Nota Settimanale – Mercati 23 09 2016

Please check the latest weekly notes directly from our Milan branch / Di seguito l’ultima nota settimanale del nostro ufficio di Milano.

Mercati nota settimanale – 23 09 2016

  1. Panoramica macro
  2. FED: una pausa di riflessione
  3. Giappone: nuovo coniglio dal cilindro!
  4. Italia: investimenti nel continente nero

Chart of the month – Euro Dollar parity: the logical song

Chart of the month

EURO DOLLAR PARITY: THE LOGICAL SONG

Source: Bloomberg
Source: Bloomberg

This recurrent question which always comes from the audience when a financial presentation is held (outside of the US of course): “and, what do you think of the dollar?”…… and it very often embarrasses the speakers because you normally can illustrate a bearish or a bullish scenario with numerous different reasons:

  • Commodities are down, so the dollar goes up
  • Risk-off environment, the dollar falls
  • Foreign Central Banks build up their USD reserves, so the Greenback rises
  • Sovereign Wealth Funds liquidate positions, the dollar is headed down
  • Forget about any short term move, the dollar is the reserve currency of the world and, as such, must fall
  • US corporates hold trillions of dollars offshore and will repatriate them…the dollar will rise…

This non-exhaustive list just show how easy it is to find a rationale for supporting a bearish or a bullish view on the dollar, and there are probably times when one or two or all these explanations are perfectly valid…. But what about a simple, verifiable and proven reason like….interest rates differential?

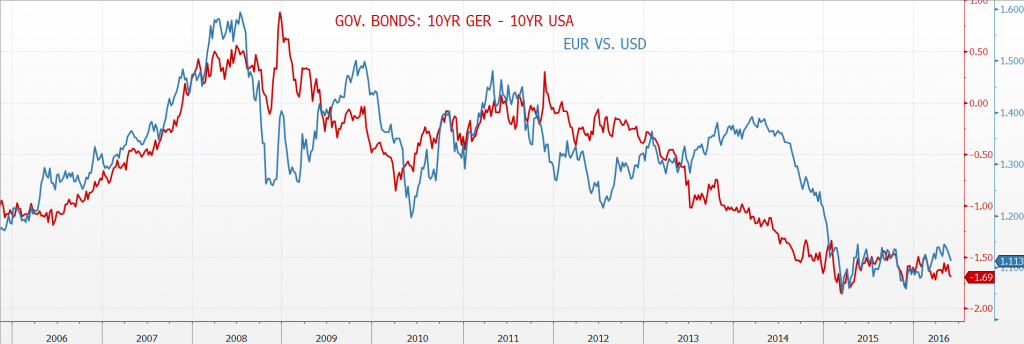
Yes, this sounds logical, and can be checked over a long period of time as the chart above shows when it comes to find a trustful cause for the euro-dollar parity movements: the interest rates differential between the US 10 year Treasury and the German 10 year Bund seem to be a good proxy for explaining the long term trend for the EUR/USD. To make it simple, when the red line falls the gap between the yield of a US 10 year Treasury and the 10 year Bund widens, so you are better remunerated for holding dollars than euros, and conversely when the red line rises. And the blue line is the euro-dollar parity.

Furthermore this comparison offers you nice positioning opportunities if you have a long term view. Just to illustrate, look at the wonderful recurrent buying opportunities you had on the dollar versus the euro from mid-2013 until mid-2014. The euro was on the rise while the interest rates differential was telling you that the opposite should have occurred.

So today what should be the answer when this terrible question arises: “and, what do you think of the dollar?”? The easiest answer is that the dollar is supported by a better remuneration, not by a wide margin though, but the speeches from the ECB and the Fed tell us that this yield differential should last for a while, so holding some dollars in a euro account makes sense today.