Chart of the Month – Sell in May and go away? or Hedge a quarter and sleep better?

Chart of the month

Sell in May and go away? or Hedge a quarter and sleep better?
Source: Bloomberg

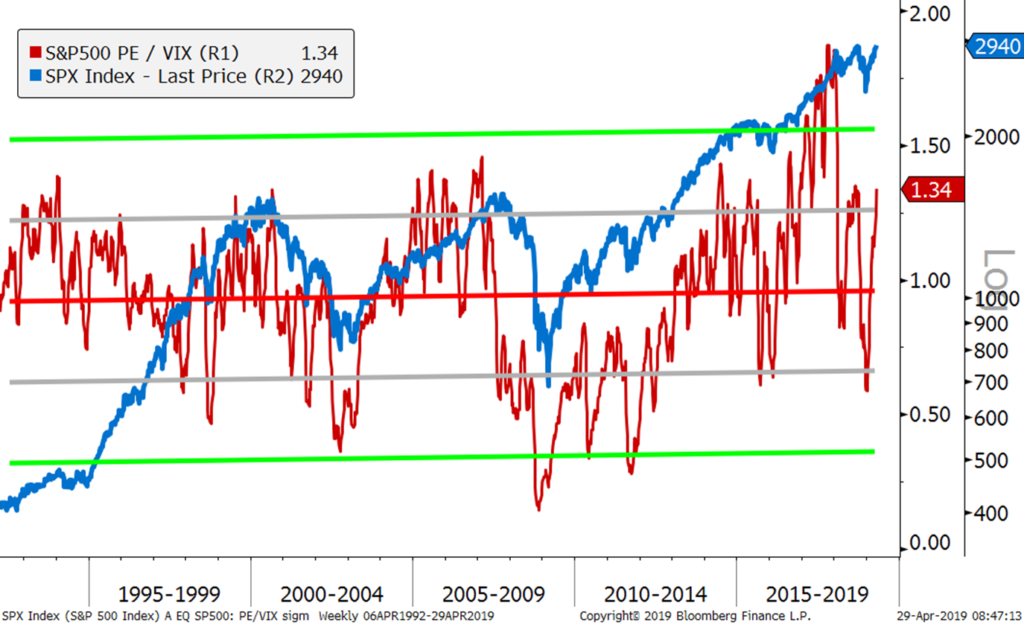
It was an extraordinary time to hedge a portfolio (or take profit) in November 2017 when the ratio S&P 500 PE/VIX reached 1.80 and was close to 3 standard deviation away from its mean (refer to our November 2017 Chart of the Month).

It was a great time to hedge a portfolio in September 2018 when this ratio reached 1.35 and was trading more than 1 standard deviation away from its mean.

After the very strong equity markets recovery this year, is it now also a good time to hedge a portfolio now that this ratio is back to 1.34 level?

Buying a put is always “too” expensive, unless your get the timing right with short maturities. It is all about finding the right balance between the underling, the maturity, the strike price and the volatility.

Whilst there are good reasons to continue to be bullish in the near term (central banks have changed policies to be more accommodative, earnings growth remain solid, global inflation is contained, trade negotiations are progressing…), we think now is a reasonable time to hedge a portfolio.

As an example: a 2% out-the-Money PUT on the S&P 500 Index with a December 20, 2019 maturity costs today about 3.3%. Therefore you can reduce your portfolio risk by 25% (or a Quarter) at a cost of 0.83%. In addition, to reduce the risk of timing, you could scale in over the next few weeks.

As the old adage says “Sell in May and Go Away”, we think it makes more sense to hedge a quarter and sleep better with an end-2019 horizon. It is a good way to remain invested with an insurance which cost is only the performance of the last 2 or 3 weeks.
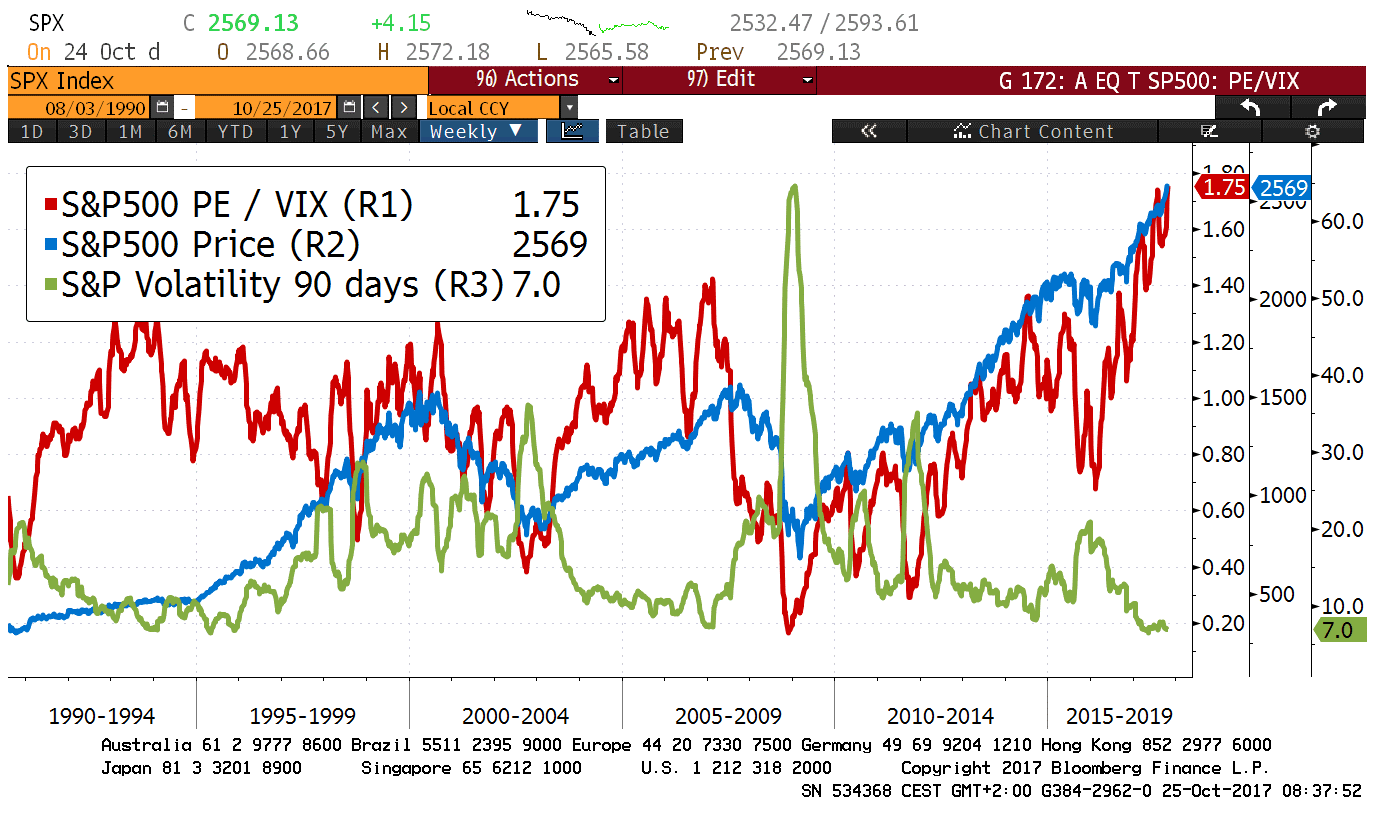
Chart of the Month – It has never been a better time to hedge your YTD performance!


Source: Bloomberg

It has never been a better time to hedge your YTD performance!

The S&P 500 Index is currently trading at all time high after being up +14.75% YTD and over +20.0% in the last 12 months.

S&P 500 90-day realized volatility is now trading at the low range of the last 27 years at just 7.0%.

The S&P 500 Price Earning ratio divided by the VIX index is at 1.75, which is by far the highest level during the same 27-year period.

Our conclusion is that is has never been that cheap to hedge a portfolio, especially to hedge YTD performance with a 3-month time horizon, where implied volatility remains very attractive.

As an example: a 2% Out-of-the-Money PUT on the S&P 500 Index with a January 18, 2018 maturity will cost you today about 1.2% with an implied volatility of just 10.0!

To hedge or not to hedge? Notz Stucki long-only chief reveals his JPY call

Pierre Mouton, head of long-only strategies at Notz Stucki answers Jessica Beard questions about the Japanese yen.

JPY Japanese yen
Pierre Mouton: “It is riskier to hedge the Japanese yen than to leave it unhedged in the current environment.”

You can read the entire article here.


Chart of the Month – Japanese Yen: to hedge or not to hedge?

Heart shaped hedges, Japanese gardens (« Johnson’s aeroplane” – INXS, 1984)

Japanese Yen
Source: Bloomberg

When it comes to buying Japanese equities for a non-Japanese investor, this emotional question always resurfaces: how do I manage the currency risk for the seeds I sowed in the Japanese garden, i.e. do I hedge the JPY currency risk on my equities or not?

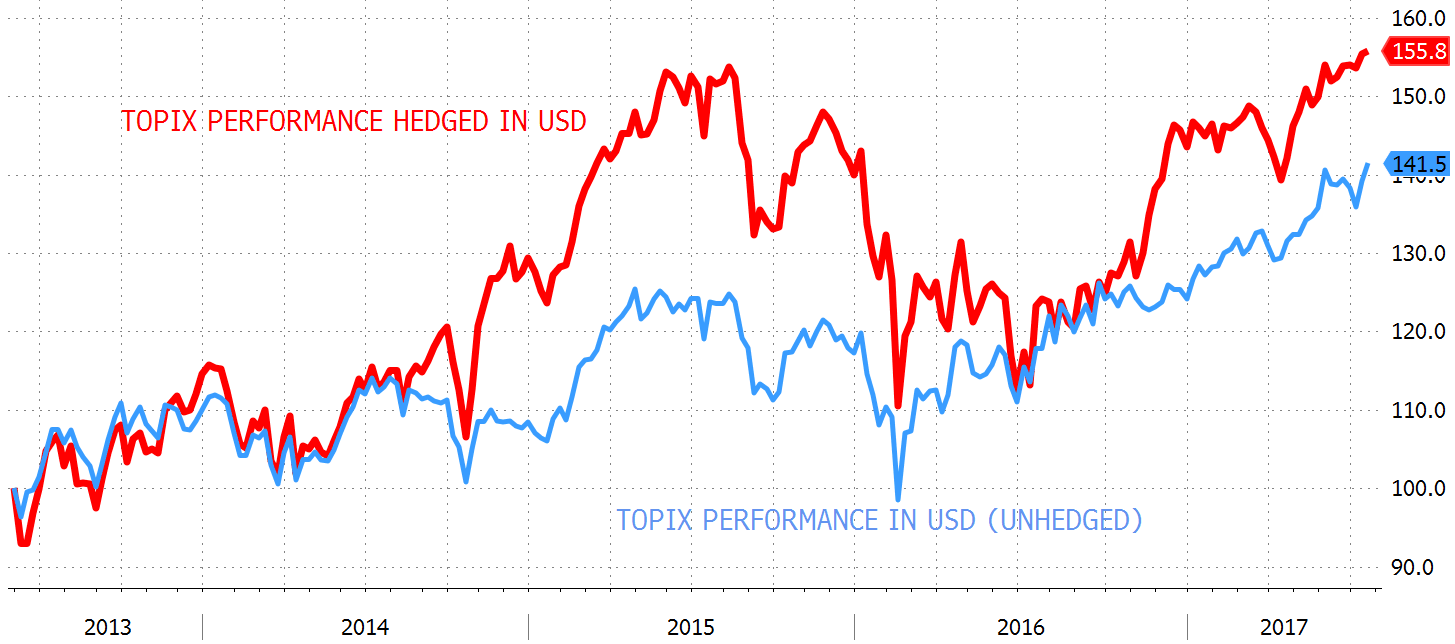
As in recent years the Bank of Japan has made it clear it is determined to maintain or increase its quantitative easing program as well as all the required stimuli to prop up inflation to decent levels; the logical financial consequence should be a weaker currency. As can be seen on the chart of the month, from the end of 2014 until the middle of 2015, the Japanese equity market applauded loudly with a spectacular rise (red line) and at the same time currency traders understood that the Yen was deemed to weaken and went short, which limited the performance of the market for a non-Japanese equity investor who had not hedged the Yen (blue line).

For those who remember, this was a no-brainer strategy: you should buy Japanese equities because of the strong tailwind provided by both the Government (remember Mr Abe’s three arrows) and the Central Bank, and at the same time hedge the Yen in order to get the full appreciation of the market (and even a bit more thanks to the interest rate differential which made selling JPY forward versus most currencies profitable). And it has worked very well, but only for a limited period: when looking at the chart of the month, it was the right strategy for 6 to 9 months (from 2014 Q4 to 2015 Q3) but then it changed.

We, at Notz Stucki, stand in the “don’t hedge” camp.

After this exceptional period of strong equity market and weak Yen, things came back to normal and the market reminded investors that the inverted correlation between the Yen and Japanese equities was valid, not only on the upside for equities, but also on the downside: you get the best of both worlds when the market rises, but you get the worst of both worlds on the downside! Therefore, apart from some specific periods, it appears that it is much better to hold Japanese equities and leave the Yen unhedged because it reduces volatility significantly. During the selected timeframe shown on the chart of the month, although having hedged the Yen would have provided a better performance, the latter comes with much higher volatility and barely surpasses the levels reached two years ago (red line), whereas the blue line (running equity and currency risk) is at the High Water Mark level.