China Narrows The AI Capability Gap

CHINA NARROWS THE AI CAPABILITY GAP

China's AI capabilities improving over time


This month’s chart illustrates one of the most significant developments in the global technology landscape: the rapid rise of China’s frontier AI capabilities and the narrowing performance gap with the United States. The graph tracks the top-performing AI model from each country between mid 2023 and late 2025. While the United States maintains a slight lead throughout the period, the visual trend is unmistakable: China is accelerating quickly, with breakthrough moments that reshape expectations about global AI competition.


The most dramatic shift occurs in early 2025 with the release of DeepSeek R1, highlighted in the chart. This model marks a turning point not only in China’s domestic AI progress but also in the broader perception of what Chinese companies can achieve under resource constraints. According to the European Union Institute for Security Studies, DeepSeek R1 demonstrated performance on par with leading American models while using far less computing power and dramatically lower training costs, challenging the assumption that semiconductor export restrictions would slow China’s progress. This breakthrough signals a structural shift: algorithmic efficiency and model design have become strategic strengths within China’s AI ecosystem.


Stanford University’s 2025 AI Index report supports the trend displayed in the graph, noting that China has significantly closed the performance gap with the United States, even though the U.S. continues to produce more frontier models overall. Chinese models such as DeepSeek R1 now rank very close to top U.S. systems on independent benchmarks including LMSYS. The chart reflects this convergence clearly, as the red line representing China rises sharply from 2023 onward, narrowing the distance with the U.S. trajectory.


DeepSeek R1’s impact also stems from its unprecedented efficiency. Reports indicate that the model was trained for approximately $6 million, far below the estimated $100 million-plus investment required for models like OpenAI’s GPT-4. This efficiency not only enabled rapid iteration but also disrupted global markets, with U.S. technology stocks experiencing significant volatility following the model’s release. The economic effects reinforce what the chart shows technologically: China is no longer simply following developments in AI but increasingly shaping the competitive landscape.


Beyond individual models, China’s broader AI ecosystem has strengthened in ways that help explain the steep upward trajectory seen in the graph. Chinese companies have embraced open-source development, improving adoption and accelerating innovation cycles. They have also benefited from strong government support, growing domestic talent pipelines, and an expanding volume of high-quality research output. According to Recorded Future’s 2025 analysis, Chinese generative AI models now trail U.S. counterparts by only three to six months, a remarkably small window given earlier expectations and one that aligns directly with the chart’s near convergence by late 2025.


Overall, the chart captures a moment of profound technological shift. While the United States retains a narrow lead in frontier AI models, China’s rapid progress—driven by efficiency, innovation, and strategic investment—has brought the two countries closer than at any previous point. The upward movement of China’s capability line is not just steep; it is indicative of a maturing ecosystem capable of producing globally competitive models despite resource constraints and external pressures. As the pace of development continues, the global AI landscape in 2026 and beyond is likely to be more multipolar, more competitive, and more dynamic than ever before.


Written by Gabriele Casati


Past performance is not indicative of future results. The views, strategies and financial instruments described in this document may not be suitable for all investors. Opinions expressed are current opinions as of date(s) appearing in this material only. References to market or composite indices, benchmarks or other measures of relative market performance over a specified period of time are provided for your information only. NS Partners provides no warranty and makes no representation of any kind whatsoever regarding the accuracy and completeness of any data, including financial market data, quotes, research notes or other financial instrument referred to in this document. This document does not constitute an offer or solicitation to any person in any jurisdiction in which such offer or solicitation is not authorized or to any person to whom it would be unlawful to make such offer or solicitation. Any reference in this document to specific securities and issuers are for illustrative purposes only, and should not be interpreted as recommendations to purchase or sell those securities. References in this document to investment funds that have not been registered with the FINMA cannot be distributed in or from Switzerland except to certain categories of eligible investors. Some of the entities of the NS Partners Group or its clients may hold a position in the financial instruments of any issuer discussed herein, or act as advisor to any such issuer.  Additional information is available on request.
© NS Partners Group
When Big Tech Puts the Old Economy to Work

Big Tech Puts the Old Economy to Work: far from a sterile world, data centers smell of dust and diesel

The commonly held image of a data center is that of grey or white rooms packed with IT and telecom equipment, seemingly operating almost autonomously with minimal human presence. In reality, a functioning data center does indeed look much like this.

Before the white room: the construction site

Yet another reality lies behind this image: one of massive construction works that can be likened to large-scale public infrastructure projects. We typically associate public works with major infrastructure developments commissioned by state or local authorities — roads, sanitation systems, railways, utilities networks, and many others.

At first glance, the construction of a data center does not fundamentally differ from such large infrastructure projects, except for one key aspect: financing. The exceptionally deep pockets of major technology players allow them to undertake these colossal investments through their vast cash-flow generation and borrowing capacity, without recourse to public funds. This represents a fundamental shift in the traditionally accepted order: private companies, through data center projects, are now commissioning a wide range of private and public contractors, whereas historically it was public-sector contracts that engaged both private and public stakeholders.

To simplify, when a technology leader embarks on the construction of a data center, the process begins with surveyors, geotechnical and environmental engineering firms, lawyers, energy consultants and architects. This is followed by project managers, inspection bodies, safety authorities and notaries. Then come the main construction phases: earthworks, civil engineering, structural works, secondary works and technical trades — excavation, foundations, steel structures, waterproofing, electrical systems, generators, cooling, fire detection, cabling and fiber optics. The list is extensive.

Insatiable energy needs

Even before a single server or IT component is installed, a data center will already have generated significant activity for players from the “old economy.” Once operational, this contribution continues. Electricity consumption — regardless of its source — is an obvious necessity, as the reliability of energy supply is the top priority for any data center. The requirements of these giants (often exceeding 200,000 square meters) are immense, typically around 100 MW or more, and must be met without fail.

Unexpected partners

Several companies that might seem unlikely beneficiaries of IT-related projects are now enjoying strong tailwinds. Utilities are one example, as are manufacturers of HVAC (Heating, Ventilation and Air Conditioning) systems. But let us focus on a more surprising case: Cummins, a U.S. specialist in heavy-duty engines (for agricultural and mining equipment, trucks, ships and generators), a company in which NS Partners has been invested for many years.

While Cummins benefits indirectly from data center construction through engines used in construction and mining equipment, it is a very direct beneficiary of the critical need for highly reliable backup generators. Cummins — like Caterpillar — has decades of operational history in this type of engine technology, allowing it to offer immediate, time-tested solutions. For mechanical enthusiasts: the backup generator is a 95-liter diesel engine, capable of starting in under 20 seconds and delivering continuous power of 2.5 MW.

The acceleration in data center construction has therefore very likely contributed significantly to the company’s remarkable share price performance (+115%) over the past two years, even though it remains, in essence, an indirect player.

A trickle-down effect benefiting the entire economy

Cummins is not an isolated case. It illustrates the highly virtuous trickle-down effect that the current data center investment cycle is having on the real economy. Moreover, at this stage, financing does not appear to be a constraint, given the colossal resources available to technology giants to pursue their ambitions.

While major global equity indices may look expensive today, they are nonetheless supported by a productive investment cycle whose effects extend far beyond the technology sector — and crucially, without reliance on public funding. This is something to welcome.


Past performance is not indicative of future results. The views, strategies and financial instruments described in this document may not be suitable for all investors. Opinions expressed are current opinions as of the date(s) appearing in this material only. References to market or composite indices, benchmarks or other measures of relative market performance over a specified period of time are provided for your information only. NS Partners provides no warranty and makes no representation of any kind whatsoever regarding the accuracy and completeness of any data, including financial market data, quotes, research notes or other financial instruments referred to in this document. This document does not constitute an offer or solicitation to any person in any jurisdiction in which such offer or solicitation is not authorized or to any person to whom it would be unlawful to make such offer or solicitation. Any reference in this document to specific securities and issuers are for illustrative purposes only, and should not be interpreted as recommendations to purchase or sell those securities. References in this document to investment funds that have not been registered with the Finma cannot be distributed in or from Switzerland except to certain categories of eligible investors. Some of the entities of the NS Partners group or its clients may hold a position in the financial instruments of any issuer discussed herein, or act as advisor to any such issuer. Additional information is available on request.  © NS Partners Group

August general market comments

“(Everybody Wanna Get Rich) Rite Away” – Dr John, 1974.

As August 2025 draws to a close, the financial markets are dancing to the frenetic beat of Dr. John’s “(Everybody Wanna Get Rich) Rite Away,” a funky anthem that captures the universal itch for quick wealth. This month, that rhythm pulsed through global equities, with the Shanghai Composite Index surging nearly 20% from its early August low, adding almost a trillion dollars in market value despite China’s economic headwinds, tariffs, a property slump and persistent deflation.

The S&P 500, meanwhile, pushed past 6,400, riding a 60%+ rally since October 2022, fueled by AI hype and Fed rate cut optimism. It’s a bull market on steroids, but the lyrics’ warning – “If you wanna be rich and you wanna be wealthy, I believe I’d rather be poor and healthy”- echo a growing unease. The rush to riches is evident in China’s 2.1 trillion yuan in margin debt, nearing the 2015 bubble peak and US tech stocks’ outsized gains, reminiscent of the dot-com frenzy. Volatility spiked early in the month, with the VIX jumping to 30 on August 5, reflecting investor jitters beneath the rally’s surface.

Central banks and policymakers tout stimulus and soft landings, but the relative disconnect from fundamentals, flat consumer prices in China, slowing US earnings growth -suggests a speculative bubble inflating alongside this bull run. Dr. John’s swampy groove reminds us that chasing instant wealth can lead to a “racka tacka tacka rum-dum game,” where very few win if sentiment sours. Caution, not just celebration, is the order of the day as September looms.

In a month marked by the end of the Q2 earnings season, which was good but not upbeat, the MSCI World added 2.5%, the S&P 500 1.9% and the MSCI Europe 0.7%. Big advances were recorded in Japan (+4.5%) and China (+10.3%). With looming rate cuts from the Fed, the dollar lost 2.3% versus the euro, US 10 year yields hovered 15 bps lower, and Gold, Bitcoin and Oil soared 4.8%, 8.3% and 6.4% respectively. The renewed political uncertainties linked to France’s very poor budget and debt situation probably limited the euro’s rise, but no panic visible so far: year to date, French 10 year yield is up 33 bps, similar to Germany (+35 bps). Still, France borrows more expensively than Greece now, which was unthinkable some years ago.

Credit fared well, but spreads are ultra-low all across fixed-income credit instruments, leaving little room for further tightening.


Past performance is not indicative of future results. The views, strategies and financial instruments described in this document may not be suitable for all investors. Opinions expressed are current opinions as of date(s) appearing in this material only. References to market or composite indices, benchmarks or other measures of relative market performance over a specified period of time are provided for your information only. NS PARTNERS SA provides no warranty and makes no representation of any kind whatsoever regarding the accuracy and completeness of any data, including financial market data or other financial instruments referred to in this general comment. This document does not constitute an offer or solicitation to any person in any jurisdiction in which such offer or solicitation is not authorized or to any person to whom it would be unlawful to make such offer or solicitation. Any reference in this document to specific securities and issuers are for illustrative purposes only, and should not be interpreted as recommendations to purchase or sell those securities. References in this document to investment funds that have not been registered with the FINMA cannot be distributed in or from Switzerland except to certain categories of eligible investors. Some of the entities of the NS Partners Group or its clients may hold a position in the financial instruments of any issuer discussed herein, or act as advisor to any such issuer. Additional information is available on request. © NS Partners Group

Chart of the month: Bubble or Bull? Why not a Bubbull?

Bubble or Bull? Why not a Bubbull?

The current mindset in the investment community is rather binary when it comes to the S&P 500. Either people speak about a bubbly market about to collapse, or about a steady and strong-footed bull market thanks to the AI cycle.

It is honestly difficult to bet the farm on the first or on the latter. US equities, and consequently global equities, as the US makes up roughly 70% of the MSCI World, are supported by impressive profit growth from its leaders, almost all technology related. At the same time, the strong performance recorded by the S&P 500 came with a significant increase in valuations, which are now close to the highest levels of the last 25 years, and getting closer to the late 90s tech bubble.

We, at NS Partners, are as torn between optimism and skepticism as the other market participants. The merits of the big Information Technology leaders and their exposure to AI are undeniable; likewise, their immense profit and cash-flow generation are nothing short of impressive. But, at the same time, valuations matter; they always did and will always do. And today valuations are very demanding; not outrageous, but very demanding. And we see many signs of speculative positioning all around the place, like the lofty returns posted by numerous non-profitable businesses.

The chart of the month shows 100 years of history for the S&P 500. If the latter might appear overextended at this point, reflecting its spectacular run of the last 10 years, it is by no means a call for a fall. The pattern was quite similar in the mid-90s, right before it literally shot up to the upside before the infamous tech bubble finally burst. Being absent from equities back then, before the collapse, was very painful.

We must admit visibility is very limited at this point. The bull market is here and well alive, while we witness flashing lights as we observe multiple bubbly signals in the current environment. A bubble and a bull? Let’s call this a Bubbull for now…


Past performance is not indicative of future results. The views, strategies and financial instruments described in this document may not be suitable for all investors. Opinions expressed are current opinions as of date(s) appearing in this material only. References to market or composite indices, benchmarks or other measures of relative market performance over a specified period of time are provided for your information only. NS Partners provides no warranty and makes no representation of any kind whatsoever regarding the accuracy and completeness of any data, including financial market data, quotes, research notes or other financial instrument referred to in this document. This document does not constitute an offer or solicitation to any person in any jurisdiction in which such offer or solicitation is not authorized or to any person to whom it would be unlawful to make such offer or solicitation. Any reference in this document to specific securities and issuers are for illustrative purposes only, and should not be interpreted as recommendations to purchase or sell those securities. References in this document to investment funds that have not been registered with the FINMA cannot be distributed in or from Switzerland except to certain categories of eligible investors. Some of the entities of the NS Partners Group or its clients may hold a position in the financial instruments of any issuer discussed herein, or act as advisor to any such issuer.  Additional information is available on request.
© NS Partners Group

Time to Take Profits in the SP500

Time to Take Profits in the SP500

Introduction to the Current Economic Climate and Stock Performance

The U.S. economy is demonstrating robust health, with GDP growth exceeding 2%. Following a series of interest rate hikes, the GDP core deflator has significantly decreased from 5.6% to 2.8% as of March 2024, with projections suggesting a further dip to 2.6% by year-end. Coupled with an exceptionally low unemployment rate of 3.8%, the economic environment seems favorable. Additionally, the surge in Artificial Intelligence technologies is profoundly influencing the S&P 500, driving profits which are expected to sustain a growth rate of over 10% for the next three years. This ensemble of positive developments naturally underpins the impressive performance of the S&P 500.

Evaluating Valuations and Strategic Alternatives

However, valuations remain a critical consideration. The current 12-month forward P/E ratio of the S&P 500 stands at 20.9, reflecting a 27% premium over the 15-year average of 16.5. This premium is even more pronounced when juxtaposed with current 10-year bond yields of 4.3%, significantly higher than the 15-year average of 2.4%. The optimism embedded in these valuations, fueled by AI’s transformative impact across several sectors such as software, semiconductors, and communications, brings to mind the adage, “This time is different.” Despite this new paradigm, we believe that the S&P 500’s valuation has stretched too thin.

For investors seeking to remain engaged in the market while adopting a conservative stance, there are several strategies to consider. One approach involves shifting part of the S&P 500 investment towards high-quality corporate bonds offering a 5.8% yield with a 3-year maturity. Alternatively, investors might consider the S&P 500 Equal Weight Index, which trades at a P/E of 17.2, closer to its 15-year average of 16.1, thereby reducing exposure to overvalued megacaps. The S&P 400 Midcap Index, with its more reasonable P/E of 15.5, presents another viable option. For those concerned about potential economic downturns, the Swiss Market Index (SMI), with its defensive positioning in pharmaceuticals, consumer staples, and insurance, and a P/E of 17.6, offers a safer haven.

Innovative Financial Instruments and Risk Mitigation

More sophisticated alternatives include investing through reputable long/short managers who can navigate market volatility more adeptly, or engaging in structured products like capital-protected notes or semi-protected “Airbag” notes, with maturities ranging from 18 to 24 months. These products allow participation in market gains while shielding against severe downturns. Additionally, advanced investors might consider protective options strategies such as the Seagull strategy; buying a Put option for December 2024 with a strike of 5300, while selling a Put at 4750 and a Call at 5725, can create a cost-neutral position with an attractive asymmetric risk profile.

Conclusion

Despite the stretched valuations, the equity market is ripe with opportunities for discerning investors. By carefully selecting investment alternatives, one can adhere to the prudent maxim of “buy low, sell high,” optimizing returns while mitigating risks in a potentially overvalued market. This balanced approach will allow investors to navigate the current economic landscape with confidence and strategic foresight.

Gli utili trimestrali restano positivi

Gli utili trimestrali restano positivi

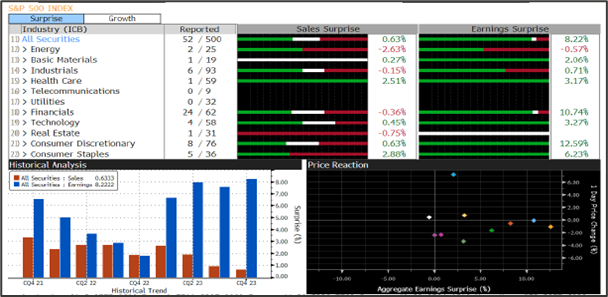
La scorsa settimana sono iniziate le pubblicazioni dei colossi del mondo bancario che, come di consueto, hanno inaugurato la stagione delle trimestrali americane. A rilasciare i primi risultati sono stati alcuni dei più grandi istituti a livello globale, tra cui JPMorgan Chase, Bank of America, Wells Fargo, Citigroup, Mellon. Il trend generale è stato di una solidità nei ricavi ancora elevata, grazie all’ampio margine di interesse che, nel caso di JPMorgan, è stato ulteriormente incrementato grazie all’acquisizione dell’ormai estinta First Republic Bank. Nonostante ciò, i rispettivi Chief Financial Officers hanno avvertito gli investitori del probabile calo futuro dei ricavi derivanti proprio dal margine di interesse, o NII (Net Interest Income), la differenza tra ciò che la banca incassa dai prestiti e quello che restituisce ai correntisti. Questo è però in linea con le aspettative di mercato, in cui gli operatori si attendono, entro la fine del 2024, tra i 4 e i 6 tagli dei tassi di interesse da parte delle banche centrali, in primis Fed e BCE. Il risultato più insoddisfacente è stato però quello di Citigroup, appesantita da addebiti una tantum che hanno fatto segnare una perdita da $1,8 miliardi nell’ultimo trimestre. La società ha inoltre annunciato tagli al personale per 20.000 unità, in modo da sostenere le azioni che, negli ultimi anni, hanno fortemente sottoperformato quelle dei competitor.

Grafico: i primi risultati trimestrali delle società dell’S&P 500 sono stati incoraggianti, Bloomberg L.P.

In questi giorni, invece, è stato il turno di nomi caldi come Netflix e Tesla, seguite da J&J, P&G, Visa, GE, ASML e Lockheed, tra le molte. Limitandoci alle prime due, i risultati sono stati nel complesso misti: Netflix ha registrato un boom di abbonati negli ultimi tre mesi del 2023, a 13,1 milioni, l’incremento trimestrale migliore di sempre, mentre Tesla ha mancato le previsioni degli analisti (EPS a $0,71 contro $0,74 previsti) con i ricavi che hanno rallentato al massimo in più di tre anni, a $25,17 miliardi. La società ha segnalato inoltre che le vendite “rallenteranno notevolmente” nel 2024, soprattutto a causa della sempre più forte competizione cinese. Alla luce di tutto questo, le aspettative per i titoli growth restano comunque molto ottimiste, non solo per un possibile pivot sui tassi di interesse, ma anche per le prospettive di crescita degli utili.

Fonti: Bloomberg, Financial Times, Reuters.

Di seguito l’ultima nota settimanale del nostro ufficio di Milano.

Nota settimanale 26.01.2024

  1. Panoramica macro
  2. Gli utili trimestrali restano positivi
  3. Taiwan, semiconduttori e IA


Disclaimer

Le performance passate non sono in nessun caso indicative per i futuri risultati. Le opinioni, le strategie ed i prodotti finanziari descritti in questo documento possono non essere idonei per tutti gli investitori. I giudizi espressi sono valutazioni correnti relative solamente alla data che appare sul documento. Questo documento non costituisce in alcun modo una offerta o una sollecitazione all’investimento in nessuna giurisdizione in cui tale offerta e/o sollecitazione non sia autorizzata né per nessun individuo per cui sarebbe ritenuta illegale. Qualsiasi riferimento contenuto in questo documento a prodotti finanziari e/o emittenti è puramente a fini illustrativi, ed in nessun caso deve essere interpretato come una raccomandazione di acquisto o vendita di tali prodotti. I riferimenti a fondi di investimento contenuti nel presente documento sono relativi a fondi che possono non essere stati autorizzati dalla Finma e perciò possono non essere distribuibili in o dalla svizzera, ad eccezione di alcune precise categorie di investitori qualificati. Alcune delle entità facenti parte del gruppo NS Partners o i suoi clienti possono detenere una posizione negli strumenti finanziari o con gli emittenti discussi nel presente documento, o ancora agire come advisor per qualsiasi degli emittenti stessi. I riferimenti a mercati, indici, benchmark, cosi come a qualsiasi altra misura relativa alla performance di mercato su uno specifico periodo di riferimento, sono forniti esclusivamente a titolo informativo.  Il contenuto di questo documento è diretto ai soli investitori professionali come definiti ai sensi della direttiva Mifid, quali banche, imprese di investimento, altri istituti finanziari autorizzati o regolamentati, imprese di assicurazione, organismi di investimento collettivo e società di gestione di tali fondi, i negoziatori per conto proprio di merci e strumenti derivati su merci, soggetti che svolgono esclusivamente la negoziazione per conto proprio su mercati di strumenti finanziari e che aderiscono indirettamente al servizio di liquidazione, nonché al sistema di compensazione e garanzia; altri investitori istituzionali, agenti di cambio e non è da intendersi per l’uso di investitori al dettaglio. Accettando questi termini e condizioni, l’utilizzatore conferma e comprende che sta agendo come investitore professionale o suo rappresentante e non come investitore al dettaglio. Informazioni aggiuntive disponibili su richiesta

© NS Partners Group

SP 10 or SP 500?

SP 10 or SP 500?

This year, 10 tech stocks accounted for 100% of the SP500’s performance. Should we be worried?

The US equity market is particularly polarised in the first half of 2023. In fact, the contribution of just 5 companies (Apple, Microsoft, Nvidia, Alphabet and Amazon) out of the 500 that make up the SP 500 accounts for 77% of the index’s performance. Add Meta, Tesla, Broadcom, AMD and Salesforce and you get 100% of the performance of the world’s largest index. This means that 490 stocks will have been ‘worthless’ so far this year.

What these ten companies have in common is obvious: they all belong, in one way or another, to the technology sector or, more broadly, to the themes of digitalisation and artificial intelligence. While digitisation has been a major performance driver for almost 10 years now, the artificial intelligence craze has given it a considerable boost, notably with the increasingly widespread use of the famous ChatGPT.

PROGRESS IS MORE WIDESPREAD IN EUROPE

By way of comparison, the 10 biggest contributors to the performance of the Stoxx 600 in Europe account for only around a third of the index’s advance at this stage, and belong to sectors as diverse as luxury goods, pharmaceuticals, commodities, technology and consumer staples. This seems much healthier, even if part of the explanation for this eclecticism in Europe is to be found in the absence of information technology mega-caps on the Old Continent.

So is this narrowness of the US market (and of the global indices, which are largely made up of the aforementioned US stars) a bad omen that we should be worried about? Yes and no.

THE MARKET CANNOT DEPEND ON A SINGLE SECTOR

Yes, because, to paraphrase a military adage, defeat is certain if the generals advance and the troops do not follow. There is a clear risk here that the enthusiasm surrounding these great leaders will run out of steam, or that their valuations will simply become too demanding, leaving the market short of leadership and at the mercy of erratic fluctuations linked to interest rates, the economic climate or commodity prices. A single sector or theme cannot be the sole sustainable source of performance in indices as broad as the SP 500 or the MSCI World.

A VERY DIFFERENT SITUATION FROM THE INTERNET BUBBLE

No, because stock market history shows us that this type of situation is nothing new: it has frequently happened in the past that a handful of stocks have taken the whole market with them, without the market subsequently collapsing. What’s more, the major leaders we’re talking about today are formidable profit and cash flow machines. The comparison with the dotcom bubble of 2000 is therefore inappropriate, since at that time the profitability of the best-performing companies was low, if not non-existent. Finally, the economic reality behind the themes of digitalisation and artificial intelligence is more than clear: the related investment cycles are gigantic and far from over.

In conclusion, we will need to keep a close eye on the behaviour of the ‘rest’ of the market over the coming weeks and months. If the underperformance of the laggards increases, we will have to be very careful, as the market would then find itself overly dependent, and therefore dangerous, on a small number of companies. If, on the other hand, participation in the performance of the indices becomes more widespread, then this would confirm the good health of the market and provide an excellent reason to be very optimistic about equity investment.


Past performance is not indicative of future results. The views, strategies and financial instruments described in this document may not be suitable for all investors. Opinions expressed are current opinions as of the date(s) appearing in this material only. References to market or composite indices, benchmarks or other measures of relative market performance over a specified period of time are provided for your information only. NS Partners provides no warranty and makes no representation of any kind whatsoever regarding the accuracy and completeness of any data, including financial market data, quotes, research notes or other financial instruments referred to in this document. This document does not constitute an offer or solicitation to any person in any jurisdiction in which such offer or solicitation is not authorized or to any person to whom it would be unlawful to make such offer or solicitation. Any reference in this document to specific securities and issuers are for illustrative purposes only, and should not be interpreted as recommendations to purchase or sell those securities. References in this document to investment funds that have not been registered with the Finma cannot be distributed in or from Switzerland except to certain categories of eligible investors. Some of the entities of the NS Partners group or its clients may hold a position in the financial instruments of any issuer discussed herein, or act as advisor to any such issuer. Additional information is available on request.

© NS Partners Group