Exploring luxury through a new lens of growth: sustainability

Exploring luxury through a new lens of growth: sustainability

Luxury is Flourishing

Recent financial reports from companies like Hermès, LVMH, Compagnie Financière Richemont, and Ferrari have impressed investors, showcasing their dedication and ongoing pursuit of profitability. According to Bain & Company, the global luxury market reached EUR 1.5 trillion in 2023, marking a robust growth of +8%-+10% compared to 2022 and setting a new industry record. Forecasts indicate continued growth, potentially reaching EUR 2.5 trillion by 2030. Investing in these assets has generated a return on investment in euros over the past five years of +424% for Hermès, +285% for Ferrari, +244% for LVMH, and +101% for Compagnie Financière Richemont, compared to a market increase of “only” +77% over the same period (MSCI World index). The strengths of these players, such as high entry barriers, effective margin management, strong balance sheets, pricing power, adaptability, and the rise of the emerging middle class, are unequivocally evident.

A Polluting Industry

After examining the financial potential of these investments, it’s crucial to also consider sustainability. How can the luxury sector position itself in this revolution? Can we truly envision a luxury sector that is more sustainable? Luxury, almost by definition, stands apart from highly polluting industries such as energy, mining, or heavy industry. However, some aspects of the luxury industry have poor environmental records. Focusing on personal luxury goods globally, which represent 24% of global spending on luxury items, it’s evident that the accessories and apparel industry performs poorly in this regard. For instance, over 8% of human-induced greenhouse gas emissions stem from the production and transportation of clothing and shoes (Quantis). However, it’s important not to equate luxury with fast fashion. Luxury purchases are inherently more considered in terms of sustainability, with each piece often holding sentimental value and encouraging intergenerational transmission, thereby reducing environmental impact.

Sustainability Embedded in the Consumer’s Consciousness

Today, sustainability plays a pivotal role in consumer purchasing decisions, especially among younger generations. Bain & Company predicts that by 2030, Generations Y and Z will represent between 75% and 85% of luxury market purchases. Generation Z undeniably places a high value on human connection, demonstrating a strong desire for meaningful interactions during their purchases. They also show a clear preference for products that are produced ethically and with consideration for the environment.

What Solutions Exist?

Aside from its participation in COP28, the luxury industry is increasingly demonstrating a commitment to social and environmental sustainability. Some major brands have already taken significant steps, such as discontinuing the use of fur and providing transparency regarding the origin of exotic skins. They are also exploring alternatives to traditional leather, such as vegan leather, mushroom leather, or cactus leather. These initiatives, integrated into a circular economy, include fabric resale platforms. Additionally, the second-hand market, favoured by younger generations, is expected to experience an annual growth rate of +7.2% between 2024 and 2032 (IMARC Group). Over the last three years, the market has experienced accelerated expansion, with Europe maintaining its position as the largest market and hard luxury accounting for over 80% of the total market share. This approach offers consumers the opportunity to acquire authentic luxury products at affordable prices while extending the lifecycle of these products within a circular economy.

The primary challenge lies in production and distribution chains. In this regard, initiatives such as the Aura Blockchain Consortium, launched nearly three years ago, aim to enhance traceability and transparency in these chains. Similarly, in the cosmetics industry, initiatives like TRASCE (Traceability Alliance for Sustainable Cosmetics) monitor the entire production process, from beauty product formulas to packaging, to support sectors in their ecological transition. Today, brands struggle to progress if they do not reduce their carbon footprint, both in packaging and production chains.

Engagement, transparency, traceability, and innovation in seeking alternatives are now crucial. By adopting these practices, the luxury industry can not only maintain its status but also shape a sustainable future. This enhances brand reputation, long-term resilience, and competitive advantage. Luxury is and will remain an attractive investment.


Past performance is not indicative of future results. The views, strategies and financial instruments described in this document may not be suitable for all investors. Opinions expressed are current opinions as of date(s) appearing in this material only. References to market or composite indices, benchmarks or other measures of relative market performance over a specified period of time are provided for your information only. NS Partners provides no warranty and makes no representation of any kind whatsoever regarding the accuracy and completeness of any data, including financial market data, quotes, research notes or other financial instrument referred to in this document. This document does not constitute an offer or solicitation to any person in any jurisdiction in which such offer or solicitation is not authorized or to any person to whom it would be unlawful to make such offer or solicitation. Any reference in this document to specific securities and issuers are for illustrative purposes only, and should not be interpreted as recommendations to purchase or sell those securities. References in this document to investment funds that have not been registered with the FINMA cannot be distributed in or from Switzerland except to certain categories of eligible investors. Some of the entities of the NS Partners Group or its clients may hold a position in the financial instruments of any issuer discussed herein, or act as advisor to any such issuer.  Additional information is available on request.
© NS Partners Group

When science meets art: choosing the right manager.

When science meets art: choosing the right manager.

Managing a multi hedge fund managers portfolio or a fund of funds, generally implies that, as the manager of such portfolio, you need to consider 3 main characteristics during your selection process from an investment point of view, (leaving aside the operational aspects intentionally for now).

  • Quality
  • Risk/return profile
  • Individual correlation

The first one is universal and resides in the intrinsic quality of a  hedge fund manager, meaning his ability to generate consistent returns in line with his proposed strategy specifications and within a corresponding time horizon. It also takes into consideration the pedigree of the main decision maker, the experience and competence of the research team.

However, this intrinsic quality leaves quite some room for interpretation as for the investment rational, since this hedge fund will be part of whole group supposedly targeting a certain return objective and potentially a risk constraint. Picking a hedge fund exclusively on these terms may have, however, undesirable impacts.

Therefore 2 other characteristics? come to consideration in that context, so to maintain the integrity of the pool and to contribute to your diversification requirements.

The first one relates to the risk/return profile of the hedge fund you are selecting. This profile provides a strong indicator as per its return capability vs. its risk level, often looked at as its volatility of returns. The more the profile is detached from the other components of the portfolio, the more diversification it is expected to contribute to the portfolio. The Sharpe ratio is an indicator of such profile, but it is not sufficient to identify the hedge fund actual positioning vs. your other investments (Graph 1).

Graph 1: Risk Return Profile. Source: NS Partners

The second characteristic is the individual correlation of the hedge fund you are selecting to each of the other components of the portfolio. The lower the correlation the better additional contribution to diversification this new hedge fund brings to the mix. It is generally accepted that a correlation of 0.5 or lower is preferable, a negative correlation being considered as the best possible situation, all other conditions being validated, i.e profitable with an acceptable level of risk (Table 1).

Table 1 : Correlation analysis. Source: Ns Partners

From there, one need to appreciate that these characteristics bear some subjective factors, not in absolute terms since a ratio is a ratio. But it is only a ratio. Meaning that as a portfolio manager of a fund of funds you still decide what ratio is acceptable and in what range of profile and correlation do you allow your portfolio to be allocated to. I can’t deny that a few years of experience, multiple market cycles proven resilience are co-substantial to rational choices. Nevertheless, it is probably where science meets art.


Past performance is not indicative of future results. The views, strategies and financial instruments described in this document may not be suitable for all investors. Opinions expressed are current opinions as of date(s) appearing in this material only. References to market or composite indices, benchmarks or other measures of relative market performance over a specified period of time are provided for your information only. NS Partners provides no warranty and makes no representation of any kind whatsoever regarding the accuracy and completeness of any data, including financial market data, quotes, research notes or other financial instrument referred to in this document. This document does not constitute an offer or solicitation to any person in any jurisdiction in which such offer or solicitation is not authorized or to any person to whom it would be unlawful to make such offer or solicitation. Any reference in this document to specific securities and issuers are for illustrative purposes only, and should not be interpreted as recommendations to purchase or sell those securities. References in this document to investment funds that have not been registered with the FINMA cannot be distributed in or from Switzerland except to certain categories of eligible investors. Some of the entities of the NS Partners Group or its clients may hold a position in the financial instruments of any issuer discussed herein, or act as advisor to any such issuer.  Additional information is available on request.
© NS Partners Group
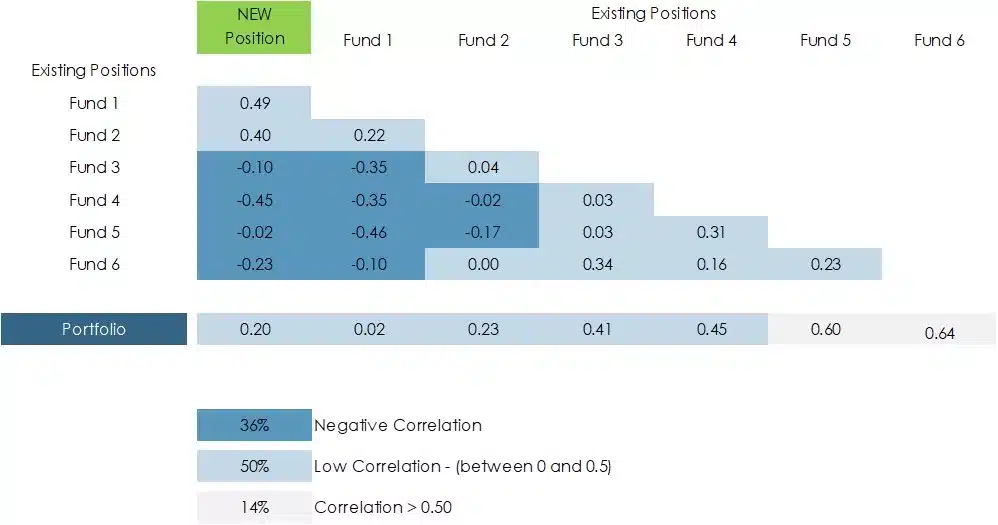
Chart of the Month – Time to invest in midcaps in the us equity market

Chart of the Month – Time to invest in midcaps in the us equity market


The investment landscape in the United States is often dominated by the allure of large-cap stocks, as evidenced by the S&P 500’s remarkable 26.3% rise in 2023. However, a closer examination of the market reveals an intriguing opportunity in mid-cap stocks. Despite the S&P 400 (Mid Caps) experiencing a lower rise of 16.4% in the same year, there’s a compelling case for why now might be the ideal time to partially pivot towards midcaps.

Over the last decade, the cumulative performance of the S&P 500, inclusive of dividends, stands at 212%, surpassing the S&P 400’s 143%. This disparity, however, opens a window into an underexplored investment avenue. According to Ibbotson data, smaller companies tend to outperform larger ones over the long term, primarily due to their faster profit growth. This trend is highlighted by Chart 1, which shows a 150% increase in Next 12 Month (NTM) profits for the S&P 400 over the last decade, compared to a 99% increase for the S&P 500.

A further analysis of market valuations and expectations reveals a striking disparity in Chart 2. The S&P 400 is currently trading at a Price-to-Earnings (PE) ratio of 14.8x NTM, a significant discount compared to the S&P 500’s 19.4x. Moreover, while the S&P 500 is expected to see a profit growth of 9.3% from year 1 to year 3, the S&P 400 anticipates a slightly higher growth rate of 10%. Thus, the market presents an opportunity to invest in an asset class with similar growth prospects to the S&P 500 but at a 24% discount.

Several factors contribute to this valuation gap. Firstly, the S&P 500’s higher exposure to the Information Technology sector (28% vs. 10%), boosted by advancements in Artificial Intelligence, skews its valuation upwards. Secondly, there have been significant inflows into ETFs linked to the S&P 500, particularly in the last three years. Lastly, midcaps are generally perceived as riskier than large caps, with a beta of 1.10 over the past decade.


Conclusion

The market, in its complex dynamics, often aligns closely with underlying economic realities. The current undervaluation of the S&P 400, when juxtaposed against its large-cap counterparts, seems excessive. For investors looking to adopt a defensive strategy, reallocating some investments from large caps to midcaps could be a prudent move. This shift not only leverages the historical trend of smaller companies outperforming larger ones but also takes advantage of the current market anomalies in valuation.


Past performance is not indicative of future results. The views, strategies and financial instruments described in this document may not be suitable for all investors. Opinions expressed are current opinions as of date(s) appearing in this material only. References to market or composite indices, benchmarks or other measures of relative market performance over a specified period of time are provided for your information only. NS Partners provides no warranty and makes no representation of any kind whatsoever regarding the accuracy and completeness of any data, including financial market data, quotes, research notes or other financial instrument referred to in this document. This document does not constitute an offer or solicitation to any person in any jurisdiction in which such offer or solicitation is not authorized or to any person to whom it would be unlawful to make such offer or solicitation. Any reference in this document to specific securities and issuers are for illustrative purposes only, and should not be interpreted as recommendations to purchase or sell those securities. References in this document to investment funds that have not been registered with the FINMA cannot be distributed in or from Switzerland except to certain categories of eligible investors. Some of the entities of the NS Partners Group or its clients may hold a position in the financial instruments of any issuer discussed herein, or act as advisor to any such issuer.  Additional information is available on request.
© NS Partners Group
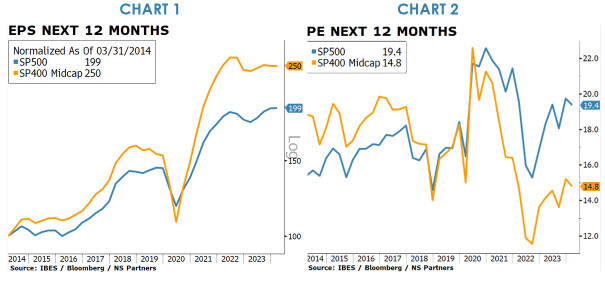
Chart of the Month – Lessons from the past

Chart of the Month – Lessons from the past

lessons from the pastWhich answer would you give to that question: “what is the most important event of the last 3 years for financial markets?”.

Many come to mind, like Covid, the war between Russia and Ukraine, the recent events in the Middle East, the hype around artificial intelligence, or the fake-start in the Chinese reopening expected boom, among other things.

I would personally give one and only one response: the 450+ basis points increase in US 10 year yields. Why so? Because this yield is the most important variable for all financial markets worldwide, as it is generally considered as the universal discounting factor.

This universal attribute makes sense: this is the yield you can obtain by investing in one of the most liquid and accessible assets, issued by the prevailing economic and military power, which is a democracy with an independent Central Bank.

The Chart of the Month illustrates the US 10 year yield evolution over a 55 years time frame. Shaded areas correspond to recessions.

What immediately strikes is the almost 40 years downtrend in yields, from 1982 to 2020, with a 0.30% historical low being touched during Covid. Another eye-popping fact is the very quick rise observed since then, as yields have nearly moved straightforward from 0.3% to 4.5-5%. Only twice in 55 years have US 10 year yields shot up by this magnitude, the previous occurrence being at the end of the 70s with the second oil shock.

Another easy conclusion is that the immense majority of market participants have always, at least until the end of 2020, acted in a falling yields environment, me included. This is not without consequences: falling yields provide a support to all financial assets and magnify valuations. They also help the economy by facilitating credit access and limiting debt servicing costs, hence less recessions. Incidentally, the chart shows that there were many more recessions when yields were rising or, at least, were much higher than during the post GFC era.

The big question is now the direction of this US 10 year yield; it seems highly unlikely that it will come back to the unprecedented lows of the past 5 years for many reasons, massive supply from the US Treasury being one of them. And this means that we are set to live in a completely different investment landscape going forward. If past is prologue, we should have a more volatile economy and assets valuations should feel the pressure of a higher discounting factor. It has started already: real estate is somewhat struggling; zombie companies are going underwater and credit accessibility is getting more challenging.

Contrarily to what prevailed during the last few years, interest rates should not provide the usual rescue to prop up asset prices for unprofitable or overvalued businesses. That is a big change, which should favour active management, and certainly jostle many investment habits.


Past performance is not indicative of future results. The views, strategies and financial instruments described in this document may not be suitable for all investors. Opinions expressed are current opinions as of date(s) appearing in this material only. References to market or composite indices, benchmarks or other measures of relative market performance over a specified period of time are provided for your information only. NS Partners provides no warranty and makes no representation of any kind whatsoever regarding the accuracy and completeness of any data, including financial market data, quotes, research notes or other financial instrument referred to in this document. This document does not constitute an offer or solicitation to any person in any jurisdiction in which such offer or solicitation is not authorized or to any person to whom it would be unlawful to make such offer or solicitation. Any reference in this document to specific securities and issuers are for illustrative purposes only, and should not be interpreted as recommendations to purchase or sell those securities. References in this document to investment funds that have not been registered with the FINMA cannot be distributed in or from Switzerland except to certain categories of eligible investors. Some of the entities of the NS Partners Group or its clients may hold a position in the financial instruments of any issuer discussed herein, or act as advisor to any such issuer.  Additional information is available on request.
© NS Partners Group

Chart of the Month – The game changer

Chart of the Month – The game changer


October saw further deterioration in market sentiment with rising geopolitical tensions. Another concern was the rising US debt supply, pushing long-term yields above 5%. Last month, the MSCI World Index was down 3.0% and since the peak in July, global equity markets lost 9.7%.

Despite this recent correction, markets are still up for the year. A resilient economy, especially in the US, surprised many investors and made the soft-landing scenario the most likely one. Overall, corporate earnings have been strong. Nevertheless, looking behind the surface, the situation looks potentially more challenging. The MSCI World equally weighted index is down 1.8% this year. Investors are realizing that rates could remain higher for longer.

This chart shows the evolution of the US 10-year bond yield since 1990. We had a great bull market for more than 30 years and the 10Y went down from 9% to less than 1% when the COVID pandemic hit. Following the huge liquidity injections made by central banks, inflation started to rise in 2021 and central banks started to raise rates again. The cost of capital increased significantly over the last 18 months. Since then, market participants have tried to adapt to this new reality but the impact on economies and corporates is just starting to be felt.

What could we expect from hedge funds in this context?

  • Short-term, long/short equity managers are defensively positioned and making money on shorts and global macro managers are up playing the steepening of the yield curve.
  • Longer-term, looking at the chart, historical data shows that hedge fund managers perform best in higher interest rate regimes. During the period between 1990 and 2007, when rates were above 4%, hedge funds outperformed markets by 3.2% on average if we consider the HFRI FoHF Composite index. Our selection of hedge funds even outperformed markets by 6.4%. Since 2008 and the GFC, rates have remained below 4% and hedge funds underperformed markets. Our selection of hedge funds underperformed markets by 2% even if the result is clearly better on a risk-adjusted basis.

The situation has changed and the 10Y, which recently reached 5%, could remain above 4% for some time. Inflation is likely to remain higher and huge deficits are expected going forward with the combination of deglobalization, energy transition, the US election and lack of buyers.

Hedge fund returns are a function of dispersion in equity markets, and higher rates help separate the winners from the losers. In addition, short-term zero rates had neutralized one of the key sources of returns for the strategy. Today with 5% rates, just because of keeping a relevant short book, a manager can basically pay for its own fees with interest gained on its shorts. Finally higher macro and market volatility, creates an environment rich with opportunities for active trading.

A hedge fund allocation on your client’s portfolio makes sense in this current investment régime.


Past performance is not indicative of future results. The views, strategies and financial instruments described in this document may not be suitable for all investors. Opinions expressed are current opinions as of date(s) appearing in this material only. References to market or composite indices, benchmarks or other measures of relative market performance over a specified period of time are provided for your information only. NS Partners provides no warranty and makes no representation of any kind whatsoever regarding the accuracy and completeness of any data, including financial market data, quotes, research notes or other financial instrument referred to in this document. This document does not constitute an offer or solicitation to any person in any jurisdiction in which such offer or solicitation is not authorized or to any person to whom it would be unlawful to make such offer or solicitation. Any reference in this document to specific securities and issuers are for illustrative purposes only, and should not be interpreted as recommendations to purchase or sell those securities. References in this document to investment funds that have not been registered with the FINMA cannot be distributed in or from Switzerland except to certain categories of eligible investors. Some of the entities of the NS Partners Group or its clients may hold a position in the financial instruments of any issuer discussed herein, or act as advisor to any such issuer.  Additional information is available on request.
© NS Partners Group

Chart of the Month – Emerging markets’ affinity for luxury: a growing trend

Chart of the Month – Emerging markets’ affinity for luxury: a growing trend

Are you currently considering investment opportunities in emerging markets, all while maintaining a strong presence in assets listed on both European and American markets?

Luxury might just be the ideal solution.

While the luxury sector began the year on a strong note, it has faced challenges in the past two months. Luxury equities saw a decline in August and September, attributed to various factors such as increasing interest rates, disappointing economic data from China including renewed concerns about the real estate market potentially affecting consumer demand and shifts in analyst recommendations. These elements have introduced uncertainty regarding these growth assets.

Nevertheless, the financial results reported during the first half of the year provide an encouraging outlook and underline the resilience of this thematic investment. Many of the leading luxury groups are predominantly listed on European and American markets. However, it is essential to assess the extent to which their revenue is derived from emerging markets. A global estimate is therefore essential.

When focusing on the most prominent and distinguished luxury brands, such as LVMH, Hermès, Kering, Moncler, and Burberry in the realm of soft luxury category, Estée Lauder and L’Oréal in the beauty and cosmetics, Compagnie Financière Richemont for hard luxury, Diageo and Pernod Ricard for spirits, and Porsche and Ferrari for automobiles, it becomes evident that the Asia-Pacific region, predominantly represented by China, plays a significant role. This region accounts for over 25% of first-half 2023 revenue. Notably, Hermès leads the pack with a substantial 49% contribution, followed closely by Burberry and Moncler at 44%. Similarly, for Compagnie Financière Richemont and Pernod Ricard the dynamic market contributes 41%. Should we broaden our perspective to encompass other emerging regions, such as for example Latin America and Africa, we find that major luxury groups maintain exposure levels exceeding 35% to emerging countries.

Why are emerging countries catalysts? The luxury sector is buoyed by consumption, increasingly driven by the expanding middle class. Emerging countries are experiencing notable economic growth, with China leading the way and poised to maintain its position at the forefront. Asian consumers aspire to showcase symbols of success and embrace cosmopolitan lifestyles. This year, however, China experienced a slowdown in growth, recovering more slowly than expected. Nevertheless, by 2030, it is predicted that the Chinese, in their own country, will be the largest consumers of luxury goods, according to the renowned firm Bain and Company.

Another rapidly growing economy making headlines is India which is re-entering the global economic spotlight on several fronts. Although luxury consumption in India is currently relatively low, it is showing substantial growth, with a remarkable 26% year-over-year increase. Millennials are the driving force behind the flourishing luxury industry, as India boasts the largest share of millennial consumers among major international economies, exceeding 30%. This demographic profile, combined with rapidly rising urban household incomes, is fueling the swift growth of luxury consumption in India. The Indian economy appears to be on a robust growth trajectory, with one of the fastest GDP growth rates among major world economies.

Investing in emerging markets through well-established and well-managed European and American companies is a prudent strategy. The luxury sector has demonstrated resilience and is considered an all-weather investment. In many cases, the Price/Earnings ratio (P/E) for these companies has returned to pre-COVID levels. Historically, buying luxury company stocks during market corrections has proven to be a profitable investment strategy.


Past performance is not indicative of future results. The views, strategies and financial instruments described in this document may not be suitable for all investors. Opinions expressed are current opinions as of date(s) appearing in this material only. References to market or composite indices, benchmarks or other measures of relative market performance over a specified period of time are provided for your information only. NS Partners provides no warranty and makes no representation of any kind whatsoever regarding the accuracy and completeness of any data, including financial market data, quotes, research notes or other financial instrument referred to in this document. This document does not constitute an offer or solicitation to any person in any jurisdiction in which such offer or solicitation is not authorized or to any person to whom it would be unlawful to make such offer or solicitation. Any reference in this document to specific securities and issuers are for illustrative purposes only, and should not be interpreted as recommendations to purchase or sell those securities. References in this document to investment funds that have not been registered with the FINMA cannot be distributed in or from Switzerland except to certain categories of eligible investors. Some of the entities of the NS Partners Group or its clients may hold a position in the financial instruments of any issuer discussed herein, or act as advisor to any such issuer.  Additional information is available on request.
© NS Partners Group

Chart of the Month – Building the perfect mousetrap for capturing alpha

Chart of the Summer – Building the perfect mousetrap for capturing alpha


Hedge fund performance overall has been disappointing this year with the HFRX Global Hedge Fund Index barely turning positive YTD as of the end of June. With your typical Balanced 60/40 portfolio up just under 10% YTD (BUT still underwater over the last 2 years!) and cash rates above 5%, hedge funds are facing a big challenge this year as the bogey has changed in the last 9 months. This year has clearly been a year for more directional equity long short managers and less so for market neutral given how narrowly led the market has been (and not only in the US with its Magnificent Seven). In addition to the lack of breadth in the market, the bi-polar factor rotation and sector re-positioning (chronic over the last few years) has caught many managers off guard (blame it on the quant funds – mostly stat arb).

Building a longstanding legacy that is built to last with a clear succession plan to compound returns with consistency over time is more challenging for investment managers that become victims of their success than it is for consumer brands, with the inevitable style drift that comes with a successful track record, as they take in more assets than they can manage, which is the ultimate nail on the coffin. The alternative: the multi-PM model which offers decentralized portfolio management with no single risk-taker able to rock the boat, combined with centralized risk management and the ability to scale in size (to a certain point) where investment opportunities arise. This model has been around since the end of the 1980s and has proved itself over time in compounding consistent returns beyond traditional benchmark indices. This month’s chart compares the Barclays Multimanager Index of 42 multi-PM platforms versus the HFRX Global Hedge Fund Index and highlights why this model has been so successful with investors (mostly pension funds, sovereign wealth funds and private banks). It should be of no surprise that most of the growth in the $4 Trio. hedge fund industry over the last few years has been in the multi-PM space given their ability in providing consistent risk-adjusted performance and more importantly their capacity to protect capital during market drawdowns in comparison to multi-strategy funds led by a single PM that sooner or later stumble and fall before re-jigging their strategy. Their capability in identifying talent and allocating capital efficiently across various strategies has proved itself to a point where the competition for talent has reached extremes and has become a game of musical chairs. Poaching traders between multi-PM platforms has now become like paying for star football players (which does not necessarily guarantee the success of a team, but who cares, if they can score big on their own).  The success of the multi-PM platform model can be further illustrated by the number of PMs that have left some of the oldest and most successful platforms over the last 25 years following a so-called stellar track record but then fail to deliver when they launch on their own. There are countless examples of these which attest to the robustness in the construct of the multi-PM platform.

The significant rise in the risk-free rate of late has somewhat challenged a platform’s ability to generate a high Sharpe ratio in addition to the subpar performance as traditional sub-strategy buckets are not working as well YTD. The most common allocations by sub-strategy within a multi-PM structure and the reason for their underperformance YTD are: Fundamental Equity Long Short (market neutral strategies are going through one of the worst years due to massive short squeezes), Discretionary Macro (tough year to call the direction of rates unless you focus on EM), Merger Arbitrage (less deals as money is no longer cheap and the regulator has taken a tougher stance), Capital Markets (the IPO/SPAC market has dried up and not many new deals) and Systematic Macro (tough year to catch trends and have completely missed the equity market rally). What has worked this year has been Global Credit, Fixed Income RV, Convertibles and unsurprisingly Commodities (where most multi-PM platforms are less exposed). Quant strategies have had mixed results but are an inherent part of the build as a diversifier of alpha sources but often plagued by “love / hate” relationships until they get thrown out and replaced down the line with a new team if they underperform over time. They are, however, better able to perform during periods of market volatility given their shorter-term time horizon.

One could say that there are way too many hedge funds today (more than the 16,041 Starbucks stores in the US alone!) fishing in the same pond for the most part i.e. the US equity market where the number of listed companies has drastically fallen from over 8,000 companies (at its peak in 1996) down to 3,700 today (thanks to private equity groups or bankruptcies). You have the same number of stocks listed in Japan today so go figure why there are barely any hedge funds left trading out of Tokyo (the capital of equity market neutral strategies)! Finding 50 of the best capacity constrained sector PMs is easy but getting 250 is more difficult with the inherent risk of diworsification. The big question today is whether the multitude of multi-PM platforms are arbitraging themselves out. The fact that they have increasing amounts of capital under management, which must be deployed across the same popular sectors and in liquid stocks, have all ended up trading the same equity names. In addition, the average holding period of a stock in the US is down to 10 months down from 5 years back in the 70s. Not surprising that we occasionally see a platform winding down a sector or sub-strategy pod which has breached its risk limits and has had to liquidate, creating a ripple effect across other multi-PM platforms which in turn are forced by their risk control teams to cut risk. The inherent leverage used within these platforms (which varies widely amongst them) to enable them to increase alpha only amplifies the ripple effect.

The big dilemma for platforms today is whether to onboard managers to have exclusivity (which comes at a price and with no performance guarantee) or work with outside independent managers and/or the sell-side. External Alpha-capture programs were first pioneered by Marshall Wace back in 2001 (initially started as a summer internship project) to enable buy-side firms to track and analyze the sell-side’s best ideas. At the time the average lifespan of a contributor was and still is around 4-5 years. Compared to the average lifespan of a PM within one of the oldest multi-pm structures today, it is now down to 17 months (Darwinism!). Perhaps the platforms concentrated down to 20-30 PMs (like the traditional fund of funds model) will do better but their capacity will be constrained. We will always be reminded that size is your biggest enemy. With at least ten new platforms slated to launch this year, the trend is far from over.

Ultimately, it is more of an art than a science and as one manager told me back in the 90s “we all use the same ingredients but it’s the recipe that makes the difference…”


Past performance is not indicative of future results. The views, strategies and financial instruments described in this document may not be suitable for all investors. Opinions expressed are current opinions as of date(s) appearing in this material only. References to market or composite indices, benchmarks or other measures of relative market performance over a specified period of time are provided for your information only. NS Partners provides no warranty and makes no representation of any kind whatsoever regarding the accuracy and completeness of any data, including financial market data, quotes, research notes or other financial instrument referred to in this document. This document does not constitute an offer or solicitation to any person in any jurisdiction in which such offer or solicitation is not authorized or to any person to whom it would be unlawful to make such offer or solicitation. Any reference in this document to specific securities and issuers are for illustrative purposes only, and should not be interpreted as recommendations to purchase or sell those securities. References in this document to investment funds that have not been registered with the FINMA cannot be distributed in or from Switzerland except to certain categories of eligible investors. Some of the entities of the NS Partners Group or its clients may hold a position in the financial instruments of any issuer discussed herein, or act as advisor to any such issuer.  Additional information is available on request.
© NS Partners Group

Chart of the Summer – A USD3 trillion investment opportunity for the energy transition

Chart of the Summer – A USD3 trillion investment opportunity for the energy transition


This economic shift is being referred to by many economists as “The New Industrial Revolution”. A glance at the chart presented by the International Energy Agency (IEA) clearly highlights the massive investment effort needed worldwide to decarbonize the economy. To visualize this investment opportunity, we embark on an imaginary journey where our guest will discover an array of interesting ideas and companies to invest in.

Mary turned on her Tesla, a marvel of electric car technology known for its eco-friendly design. The digital dashboard lit up, indicating a battery power level of seventy-five percent. Mary admired her vehicle, not just for its quick, quiet ride but also for what it symbolized – a step towards environmental stewardship.

She was accompanied by her co-pilot, a recent chemistry graduate. Together, they admired the sight of towering windmills dotting the landscape. These were Vestas windmills, renowned for their effectiveness in transforming wind power into clean electricity. The co-pilot noted that the motors and rotors of these windmills, much like those of their Tesla, relied on rare earth elements due to their unique magnetic properties.

Their journey took them past fields glittering with solar panels from First Solar, Canadian Solar and other manufacturers. These solar farms, managed by Iberdrola, captured sunlight and transformed it into energy. Amidst these farms were electrolysers, which used electricity to separate water into hydrogen and oxygen. This hydrogen was stored and later used to create ammonia, a clean and potent fuel. Some of this hydrogen was sent to a steel manufacturing company that use it to produce clean steel.

Nearby was a plant that used the ammonia to manufacture fertilizers, enriching soil to produce good crops. The ammonia was also loaded into ships, fueling their voyages across the globe without leaving behind a trail of pollution.

As the Tesla signaled the need for a recharge, Mary pulled into a nearby charging station. The station derived its power from a compact yet potent 200 MW mini-reactor nuclear power plant. The co-pilot explained how uranium, despite its contentious history, was critical for these nuclear reactors due to its immense energy-producing capability.

Upon reaching her modern, eco-conscious house in the countryside, Mary could see the solar panels adorning the roof. Connected to efficient Enphase inverters, these panels harnessed sunlight and converted it into electricity. Excess energy was stored in reliable Samsung SDI batteries, a crucial component requiring significant amounts of lithium, a light, yet energy-dense metal.

The house was also equipped with a state-of-the-art Johnson Controls heat pump system and a Schneider smart home system, providing not only comfort but also efficient energy usage.

This journey demonstrated several ideas to profit from this USD3 trillion investment opportunity. These opportunities will appeal to ESG investors, non-ESG investors, growth investors and value investors. Both developed and emerging countries are investing in these technologies, and current valuations do not yet reflect the expected growth.

Embark on a USD3 trillion investment journey, happy investing!


Past performance is not indicative of future results. The views, strategies and financial instruments described in this document may not be suitable for all investors. Opinions expressed are current opinions as of date(s) appearing in this material only. References to market or composite indices, benchmarks or other measures of relative market performance over a specified period of time are provided for your information only. NS Partners provides no warranty and makes no representation of any kind whatsoever regarding the accuracy and completeness of any data, including financial market data, quotes, research notes or other financial instrument referred to in this document. This document does not constitute an offer or solicitation to any person in any jurisdiction in which such offer or solicitation is not authorized or to any person to whom it would be unlawful to make such offer or solicitation. Any reference in this document to specific securities and issuers are for illustrative purposes only, and should not be interpreted as recommendations to purchase or sell those securities. References in this document to investment funds that have not been registered with the FINMA cannot be distributed in or from Switzerland except to certain categories of eligible investors. Some of the entities of the NS Partners Group or its clients may hold a position in the financial instruments of any issuer discussed herein, or act as advisor to any such issuer.  Additional information is available on request.
© NS Partners Group

Graphique du mois – Être ou ne pas être dans un marché haussier

Être ou ne pas être dans un marché haussier

Source: NS Partners, Bloomberg

Après des performances fortement négatives en 2022, les marchés boursiers mondiaux sont en nette progression depuis le début de l’année. La seule exception est la Chine, où la reprise macroéconomique continue de décevoir les investisseurs. Mais si l’on considère les marchés développés, l’indice S&P 500 est en hausse de +8,9 % depuis le début de l’année à la fin du mois de mai, l’indice MSCI Europe de +6,6 % et l’indice Topix de +12,6%.

Malgré des incertitudes accrues sur le front macroéconomique (ralentissement économique, Allemagne en récession technique, inflation en baisse mais toujours à des niveaux élevés, tensions géopolitiques persistantes), la volatilité du marché s’est considérablement affaiblie (les indices VIX et VStoxx sont proches de 15, alors qu’ils étaient respectivement supérieurs à 20 et 25 la plupart du temps au cours des derniers mois). La situation n’est pas aussi grave qu’on le pensait initialement, en particulier si l’on considère les bénéfices des entreprises, mais il est toujours très surprenant de voir l’indice S&P 500 complètement immunisé contre la faillite de grandes banques américaines en mars, alors qu’au même moment le rendement des obligations d’État américaines à 2 ans est passé de 5,2 % à 3,9 % en deux jours, une amplitude qui n’avait pas été observée depuis octobre 1987 !

En fait, il se passe beaucoup de choses en coulisses et le marché dans son ensemble n’a été soutenu cette année que par un très petit nombre de grandes valeurs technologiques américaines à forte capitalisation liées à l’intelligence artificielle. Le graphique montre l’écart de rendement depuis le début de l’année entre le S&P 500 équipondéré et le S&P 500 pondéré en fonction de la capitalisation boursière. L’écart n’a jamais été aussi important depuis 1990 !

Comment les gestionnaires actifs se comportent-ils dans l’environnement de marché actuel ? Sans surprise, nous constatons une très grande dispersion entre les gestionnaires, en fonction de leur positionnement sectoriel, de leur préférence pour les petites ou grandes capitalisations, de leur orientation croissance ou valeur, de leur concentration et, enfin, de leur sélection de titres. Ce qui est rassurant, c’est que notre sélection de stock pickers sur lesquels nous avons une forte conviction et qui ont souffert l’année dernière sont fortement de retour : Blackrock Global Unconstrained est en hausse de +20,5% depuis le début de l’année par rapport à -25,5% en 2022, Cantillon de +10,7% par rapport à -23,4% en 2022, et AKO de +16,8% par rapport à -18,5% en 2022. Une part importante des pertes subies en 2022 a déjà été récupérée, alors que l’indice MSCI World est en hausse de +7,6 % depuis le début de l’année après avoir perdu -19,5 % en 2022, ce qui ne représente que 39 % !

En ce qui concerne les gérants long/short equity, ils sont de nouveau en territoire positif en termes de génération d’alpha. En Asie et en Chine, la plupart d’entre eux ont été en mesure de se protéger efficacement contre les baisses et notre approche de la diversification les a aidés. Dans les marchés développés, alors que le cycle de hausse des taux des banques centrales semble se rapprocher de la fin aux États-Unis et montre une voie plus visible en Europe, les fondamentaux font à nouveau la différence. Notre mandat long/short européen est en hausse de +9% depuis le début de l’année, ce qui est un bon résultat si l’on considère que les gestionnaires sont bien diversifiés en termes de secteurs et plutôt prudents en termes d’exposition au marché.

Dans ce contexte, il est logique d’avoir des portefeuilles d’actions gérés en fonction du risque.


Les performances passées ne garantissent pas les résultats futurs. Les opinions, stratégies et instruments financiers décrits dans le présent document peuvent ne pas convenir à tous les investisseurs. Les opinions énoncées sont celles valables à la date de publication de ce document. Toute référence aux indices de marches ou composites, indices de référence, ou autres mesures de performance relative des marches a une certaine période sont indiquées à titre d’information. NS Partners ne donne aucune garantie et n’est aucunement responsable de l’exactitude et de l’exhaustivité de l’ensemble des informations (données financières de marche, cours de bourse, avis de recherche ou description de tout autre instrument financier) contenus dans ce document. Le présent document n’est pas destiné aux personnes ou entités qui seraient citoyennes ou résidentes d’un lieu, état, pays ou juridiction dans lesquels sa distribution, sa publication, sa mise à disposition ou son utilisation seraient contraires aux lois ou règlements en vigueur. Les informations et données fournies dans le présent document sont communiquées à titre indicatif uniquement et ne constituent ni une offre, ni une incitation à acheter, vendre ou souscrire a des titres ou tout autre instrument financier. Il est fait référence dans ce document a des fonds d’investissement qui n’ont pas été enregistrés auprès de la Finma et ne peuvent donc pas être distribues en ou depuis la suisse sauf à certaines catégories d’investisseurs éligibles. Certaines des sociétés du groupe NS Partners ou ses clients peuvent être détenteurs d’une position dans les instruments financiers de l’un des émetteurs mentionnes dans ce document, ou agir en tant que consultant pour l’un d’eux. Des informations supplémentaires sont disponibles sur demande.

© Groupe NS Partners

Gráfico del mes – Estar o no estar en un mercado alcista

Estar o no estar en un mercado alcista

Source: NS Partners, Bloomberg

Tras unos resultados negativos en 2022, los mercados bursátiles mundiales están subiendo a buen ritmo desde principios de año. La única excepción es China, donde la recuperación macroeconómica sigue decepcionando a los inversores. Pero si consideramos los mercados desarrollados, el índice S&P 500 ha subido un +8,9% YTD a finales de mayo, el índice MSCI Europe un +6,6% y el índice Topix un +12,6%.

A pesar de las incertidumbres en el frente macroeconómico (ralentización económica, Alemania en recesión técnica, disminución de la inflación pero aún en niveles elevados, tensiones geopolíticas), la volatilidad del mercado se ha debilitado significativamente (el índice VIX y las marcas recientes del VStoxx se acercan a 15, cuando durante los últimos meses estuvieron respectivamente por encima de 20 y 25 la mayor parte del tiempo). La situación no es tan grave como se pensaba inicialmente, en particular si nos fijamos en los beneficios empresariales, pero sigue siendo realmente sorprendente ver al índice S&P 500 completamente inmune a la quiebra de grandes bancos estadounidenses en marzo, cuando al mismo tiempo el rendimiento de la deuda pública estadounidense a 2 años bajó del 5,2% al 3,9% en 2 días, ¡una amplitud no vista desde octubre de 1987!

De hecho, están ocurriendo muchas cosas en segundo plano, este año, el mercado en general se ha visto impulsado únicamente por unos pocos valores tecnológicos estadounidenses de gran capitalización relacionados con la inteligencia artificial. El gráfico muestra el diferencial de rentabilidad interanual entre el S&P 500 de ponderación igual y el S&P 500 de ponderación por capitalización bursátil. La diferencia nunca había sido tan amplia desde 1990.

¿Cómo se comportan los gestores activos en este entorno de mercado? Sin sorpresa, asistimos a una dispersión muy elevada entre gestores, en función de su posicionamiento sectorial, preferencia por las pequeñas o grandes capitalizaciones, orientación al crecimiento o al valor, concentración y, por último, selección de valores. Lo que es tranquilizador es el hecho de que nuestra selección de gestores de selección de valores, en los que tenemos una gran convicción y que sufrieron el año pasado, han vuelto con fuerza: Blackrock Global Unconstrained sube +20,5% YTD & -25,5% en 2022, Cantillon +10,7% & -23,4% en 2022, y AKO +16,8% & -18,5% en 2022. Ya se ha recuperado una parte importante de las pérdidas de 2022, mientras que el índice MSCI World ha subido un 7,6% hasta la fecha tras perder un 19,5% en 2022, lo que representa sólo un 39%.

En cuanto a los gestores de renta variable long/short, vuelven a estar en territorio positivo en términos de generación de alfa. En Asia y China, la mayoría de ellos han sido capaces de protegerse eficazmente de las caídas y nuestro enfoque de diversificación ha ayudado. En mercados desarrollados, a medida que el ciclo de subidas de tipos de los bancos centrales parece acercarse a su fin en EE.UU. y muestra una trayectoria más visible en Europa, los fundamentales vuelven a ser determinantes. Nuestro mandato europeo long/short ha subido un 9% hasta la fecha, lo que constituye un buen resultado si se tiene en cuenta que los gestores están bien diversificados en términos de sectores y son bastante prudentes en cuanto a la exposición al mercado.

Tener carteras de renta variable gestionadas por el riesgo en este contexto tiene sentido.


Los resultados pasados no implican resultados futuros. Las opiniones, estrategias e instrumentos financieros que se describen en el presente documento pueden no ser convenientes para todos los inversores. Las opiniones expresadas son sólo las del momento en la(s) fecha(s) que aparece(n) en este material. Las referencias a índices de mercado o compuestos, índices de referencia u otras medidas de resultados relativos de los mercados durante un período específico sólo se proveen a título informativo. NS Partners no garantiza ni es responsable de la exactitud o la integridad de las informaciones (datos financieros de mercado, precios de bolsa, resultados de investigación u otros instrumentos financieros) que se mencionan en este documento. El presente documento no constituye una oferta ni solicitud a ninguna persona ni jurisdicción donde tal oferta o solicitud no esté autorizada ni a ninguna persona a quien sería ilegal hacer dicha oferta o solicitud. Toda referencia en este documento a instrumentos específicos o a emisores sólo tiene una finalidad ilustrativa y no debe ser interpretada como una recomendación para la compra o venta de dicho instrumento. Las referencias en este documento a fondos de inversión se aplican a fondos que no han sido registrados por la Finma y que por lo tanto no pueden ser distribuidos en o desde suiza excepto a ciertas categorías de inversores. Algunas de las empresas del grupo NS Partners o sus clientes pueden tener posiciones en los instrumentos financieros de alguno de los emisores mencionados en este documento, o ser asesor de uno de ellos. Hay información adicional disponible a solicitud.

© Grupo NS Partners