Chart of the month: Gold, Gold, Gold. Switzerland the quiet giant.

Gold, Gold, Gold. Switzerland the quiet giant.


gold Switzerland
Source: World Gold Council, Swiss Federal Statistical Office, Bloomberg, NS Partners. Image generated by artificial intelligence based on author-provided content.


The gold rush is back. Gold has climbed to new record highs, emerging as the top-performing asset class year-to-date, with gains above +50% in USD. From private investors to central banks, demand has surged across the board.

Gold remains an ultimate hedge against inflation, currency debasement and uncertainty, a safe harbor when markets tremble. Amid the global search for safety, Switzerland stands out as a quiet pillar of strength.

Did you know that Switzerland holds more gold per capita than any other country in the world?

The Swiss National Bank currently holds around 1,040 tonnes of gold, equivalent to roughly 100 billion Swiss francs in value, placing Switzerland seventh worldwide in total holdings. On a per capita basis, this corresponds to about 118 grams of gold per Swiss resident, which is the highest ratio in the world. Although the Swiss franc has not been backed by gold since 1999, the Swiss National Bank continues to maintain substantial reserves. This reflects Switzerland’s enduring tradition of financial prudence, stability and independence.

This impressive reserve position has a measurable impact. In 2024, the rise in gold prices generated an unrealized gain of CHF 21.2 billion, contributing significantly to the Swiss National Bank’s record profit of around CHF 80 billion. In early 2025, gold prices surged further, adding CHF 12.8 billion in valuation gains in the first quarter, partially offsetting foreign currency headwinds. By mid-2025, after a moderate correction in gold prices, unrealized gains stood at CHF 8.6 billion, confirming gold’s role as a key stabilizing factor in the Swiss National Bank’s balance sheet.

Switzerland’s strength extends well beyond its reserves. The same principles that underpin its monetary discipline are visible across the real economy. A focus on high value-added sectors such as pharmaceuticals, chemicals, machinery and precision engineering has built a foundation of sustainable growth and innovation, rather than reliance on low-margin industries such as automotive.

Resilience is not only an economic story; it is also a market story. Switzerland is a strong economy, with a resilient industry and a robust financial market. Over the past decade, Swiss small and mid-caps have shown consistent outperformance. While this momentum has moderated over the past five years, performance has reaccelerated over the most recent twelve months. Still, it is precisely within Swiss small and mid-caps that the most attractive opportunities reside, featuring hidden champions and niche innovators offering long-term value potential.


Past performance is not indicative of future results. The views, strategies and financial instruments described in this document may not be suitable for all investors. Opinions expressed are current opinions as of date(s) appearing in this material only. References to market or composite indices, benchmarks or other measures of relative market performance over a specified period of time are provided for your information only. NS Partners provides no warranty and makes no representation of any kind whatsoever regarding the accuracy and completeness of any data, including financial market data, quotes, research notes or other financial instrument referred to in this document. This document does not constitute an offer or solicitation to any person in any jurisdiction in which such offer or solicitation is not authorized or to any person to whom it would be unlawful to make such offer or solicitation. Any reference in this document to specific securities and issuers are for illustrative purposes only, and should not be interpreted as recommendations to purchase or sell those securities. References in this document to investment funds that have not been registered with the FINMA cannot be distributed in or from Switzerland except to certain categories of eligible investors. Some of the entities of the NS Partners Group or its clients may hold a position in the financial instruments of any issuer discussed herein, or act as advisor to any such issuer.  Additional information is available on request.
© NS Partners Group
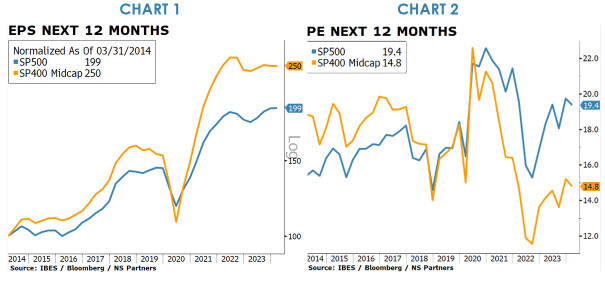
Chart of the month: Gold, Gold, Gold. Switzerland the quiet giant.

Gold, Gold, Gold. Switzerland the quiet giant.


gold Switzerland
Source: World Gold Council, Swiss Federal Statistical Office, Bloomberg, NS Partners. Image generated by artificial intelligence based on author-provided content.


The gold rush is back. Gold has climbed to new record highs, emerging as the top-performing asset class year-to-date, with gains above +50% in USD. From private investors to central banks, demand has surged across the board.

Gold remains an ultimate hedge against inflation, currency debasement and uncertainty, a safe harbor when markets tremble. Amid the global search for safety, Switzerland stands out as a quiet pillar of strength.

Did you know that Switzerland holds more gold per capita than any other country in the world?

The Swiss National Bank currently holds around 1,040 tonnes of gold, equivalent to roughly 100 billion Swiss francs in value, placing Switzerland seventh worldwide in total holdings. On a per capita basis, this corresponds to about 118 grams of gold per Swiss resident, which is the highest ratio in the world. Although the Swiss franc has not been backed by gold since 1999, the Swiss National Bank continues to maintain substantial reserves. This reflects Switzerland’s enduring tradition of financial prudence, stability and independence.

This impressive reserve position has a measurable impact. In 2024, the rise in gold prices generated an unrealized gain of CHF 21.2 billion, contributing significantly to the Swiss National Bank’s record profit of around CHF 80 billion. In early 2025, gold prices surged further, adding CHF 12.8 billion in valuation gains in the first quarter, partially offsetting foreign currency headwinds. By mid-2025, after a moderate correction in gold prices, unrealized gains stood at CHF 8.6 billion, confirming gold’s role as a key stabilizing factor in the Swiss National Bank’s balance sheet.

Switzerland’s strength extends well beyond its reserves. The same principles that underpin its monetary discipline are visible across the real economy. A focus on high value-added sectors such as pharmaceuticals, chemicals, machinery and precision engineering has built a foundation of sustainable growth and innovation, rather than reliance on low-margin industries such as automotive.

Resilience is not only an economic story; it is also a market story. Switzerland is a strong economy, with a resilient industry and a robust financial market. Over the past decade, Swiss small and mid-caps have shown consistent outperformance. While this momentum has moderated over the past five years, performance has reaccelerated over the most recent twelve months. Still, it is precisely within Swiss small and mid-caps that the most attractive opportunities reside, featuring hidden champions and niche innovators offering long-term value potential.


Past performance is not indicative of future results. The views, strategies and financial instruments described in this document may not be suitable for all investors. Opinions expressed are current opinions as of date(s) appearing in this material only. References to market or composite indices, benchmarks or other measures of relative market performance over a specified period of time are provided for your information only. NS Partners provides no warranty and makes no representation of any kind whatsoever regarding the accuracy and completeness of any data, including financial market data, quotes, research notes or other financial instrument referred to in this document. This document does not constitute an offer or solicitation to any person in any jurisdiction in which such offer or solicitation is not authorized or to any person to whom it would be unlawful to make such offer or solicitation. Any reference in this document to specific securities and issuers are for illustrative purposes only, and should not be interpreted as recommendations to purchase or sell those securities. References in this document to investment funds that have not been registered with the FINMA cannot be distributed in or from Switzerland except to certain categories of eligible investors. Some of the entities of the NS Partners Group or its clients may hold a position in the financial instruments of any issuer discussed herein, or act as advisor to any such issuer.  Additional information is available on request.
© NS Partners Group

Chart of the Month – Time to invest in midcaps in the us equity market

Chart of the Month – Time to invest in midcaps in the us equity market


The investment landscape in the United States is often dominated by the allure of large-cap stocks, as evidenced by the S&P 500’s remarkable 26.3% rise in 2023. However, a closer examination of the market reveals an intriguing opportunity in mid-cap stocks. Despite the S&P 400 (Mid Caps) experiencing a lower rise of 16.4% in the same year, there’s a compelling case for why now might be the ideal time to partially pivot towards midcaps.

Over the last decade, the cumulative performance of the S&P 500, inclusive of dividends, stands at 212%, surpassing the S&P 400’s 143%. This disparity, however, opens a window into an underexplored investment avenue. According to Ibbotson data, smaller companies tend to outperform larger ones over the long term, primarily due to their faster profit growth. This trend is highlighted by Chart 1, which shows a 150% increase in Next 12 Month (NTM) profits for the S&P 400 over the last decade, compared to a 99% increase for the S&P 500.

A further analysis of market valuations and expectations reveals a striking disparity in Chart 2. The S&P 400 is currently trading at a Price-to-Earnings (PE) ratio of 14.8x NTM, a significant discount compared to the S&P 500’s 19.4x. Moreover, while the S&P 500 is expected to see a profit growth of 9.3% from year 1 to year 3, the S&P 400 anticipates a slightly higher growth rate of 10%. Thus, the market presents an opportunity to invest in an asset class with similar growth prospects to the S&P 500 but at a 24% discount.

Several factors contribute to this valuation gap. Firstly, the S&P 500’s higher exposure to the Information Technology sector (28% vs. 10%), boosted by advancements in Artificial Intelligence, skews its valuation upwards. Secondly, there have been significant inflows into ETFs linked to the S&P 500, particularly in the last three years. Lastly, midcaps are generally perceived as riskier than large caps, with a beta of 1.10 over the past decade.


Conclusion

The market, in its complex dynamics, often aligns closely with underlying economic realities. The current undervaluation of the S&P 400, when juxtaposed against its large-cap counterparts, seems excessive. For investors looking to adopt a defensive strategy, reallocating some investments from large caps to midcaps could be a prudent move. This shift not only leverages the historical trend of smaller companies outperforming larger ones but also takes advantage of the current market anomalies in valuation.


Past performance is not indicative of future results. The views, strategies and financial instruments described in this document may not be suitable for all investors. Opinions expressed are current opinions as of date(s) appearing in this material only. References to market or composite indices, benchmarks or other measures of relative market performance over a specified period of time are provided for your information only. NS Partners provides no warranty and makes no representation of any kind whatsoever regarding the accuracy and completeness of any data, including financial market data, quotes, research notes or other financial instrument referred to in this document. This document does not constitute an offer or solicitation to any person in any jurisdiction in which such offer or solicitation is not authorized or to any person to whom it would be unlawful to make such offer or solicitation. Any reference in this document to specific securities and issuers are for illustrative purposes only, and should not be interpreted as recommendations to purchase or sell those securities. References in this document to investment funds that have not been registered with the FINMA cannot be distributed in or from Switzerland except to certain categories of eligible investors. Some of the entities of the NS Partners Group or its clients may hold a position in the financial instruments of any issuer discussed herein, or act as advisor to any such issuer.  Additional information is available on request.
© NS Partners Group

Chart of the Month – Lessons from the past

Chart of the Month – Lessons from the past

lessons from the pastWhich answer would you give to that question: “what is the most important event of the last 3 years for financial markets?”.

Many come to mind, like Covid, the war between Russia and Ukraine, the recent events in the Middle East, the hype around artificial intelligence, or the fake-start in the Chinese reopening expected boom, among other things.

I would personally give one and only one response: the 450+ basis points increase in US 10 year yields. Why so? Because this yield is the most important variable for all financial markets worldwide, as it is generally considered as the universal discounting factor.

This universal attribute makes sense: this is the yield you can obtain by investing in one of the most liquid and accessible assets, issued by the prevailing economic and military power, which is a democracy with an independent Central Bank.

The Chart of the Month illustrates the US 10 year yield evolution over a 55 years time frame. Shaded areas correspond to recessions.

What immediately strikes is the almost 40 years downtrend in yields, from 1982 to 2020, with a 0.30% historical low being touched during Covid. Another eye-popping fact is the very quick rise observed since then, as yields have nearly moved straightforward from 0.3% to 4.5-5%. Only twice in 55 years have US 10 year yields shot up by this magnitude, the previous occurrence being at the end of the 70s with the second oil shock.

Another easy conclusion is that the immense majority of market participants have always, at least until the end of 2020, acted in a falling yields environment, me included. This is not without consequences: falling yields provide a support to all financial assets and magnify valuations. They also help the economy by facilitating credit access and limiting debt servicing costs, hence less recessions. Incidentally, the chart shows that there were many more recessions when yields were rising or, at least, were much higher than during the post GFC era.

The big question is now the direction of this US 10 year yield; it seems highly unlikely that it will come back to the unprecedented lows of the past 5 years for many reasons, massive supply from the US Treasury being one of them. And this means that we are set to live in a completely different investment landscape going forward. If past is prologue, we should have a more volatile economy and assets valuations should feel the pressure of a higher discounting factor. It has started already: real estate is somewhat struggling; zombie companies are going underwater and credit accessibility is getting more challenging.

Contrarily to what prevailed during the last few years, interest rates should not provide the usual rescue to prop up asset prices for unprofitable or overvalued businesses. That is a big change, which should favour active management, and certainly jostle many investment habits.


Past performance is not indicative of future results. The views, strategies and financial instruments described in this document may not be suitable for all investors. Opinions expressed are current opinions as of date(s) appearing in this material only. References to market or composite indices, benchmarks or other measures of relative market performance over a specified period of time are provided for your information only. NS Partners provides no warranty and makes no representation of any kind whatsoever regarding the accuracy and completeness of any data, including financial market data, quotes, research notes or other financial instrument referred to in this document. This document does not constitute an offer or solicitation to any person in any jurisdiction in which such offer or solicitation is not authorized or to any person to whom it would be unlawful to make such offer or solicitation. Any reference in this document to specific securities and issuers are for illustrative purposes only, and should not be interpreted as recommendations to purchase or sell those securities. References in this document to investment funds that have not been registered with the FINMA cannot be distributed in or from Switzerland except to certain categories of eligible investors. Some of the entities of the NS Partners Group or its clients may hold a position in the financial instruments of any issuer discussed herein, or act as advisor to any such issuer.  Additional information is available on request.
© NS Partners Group

Chart of the Month – The game changer

Chart of the Month – The game changer


October saw further deterioration in market sentiment with rising geopolitical tensions. Another concern was the rising US debt supply, pushing long-term yields above 5%. Last month, the MSCI World Index was down 3.0% and since the peak in July, global equity markets lost 9.7%.

Despite this recent correction, markets are still up for the year. A resilient economy, especially in the US, surprised many investors and made the soft-landing scenario the most likely one. Overall, corporate earnings have been strong. Nevertheless, looking behind the surface, the situation looks potentially more challenging. The MSCI World equally weighted index is down 1.8% this year. Investors are realizing that rates could remain higher for longer.

This chart shows the evolution of the US 10-year bond yield since 1990. We had a great bull market for more than 30 years and the 10Y went down from 9% to less than 1% when the COVID pandemic hit. Following the huge liquidity injections made by central banks, inflation started to rise in 2021 and central banks started to raise rates again. The cost of capital increased significantly over the last 18 months. Since then, market participants have tried to adapt to this new reality but the impact on economies and corporates is just starting to be felt.

What could we expect from hedge funds in this context?

  • Short-term, long/short equity managers are defensively positioned and making money on shorts and global macro managers are up playing the steepening of the yield curve.
  • Longer-term, looking at the chart, historical data shows that hedge fund managers perform best in higher interest rate regimes. During the period between 1990 and 2007, when rates were above 4%, hedge funds outperformed markets by 3.2% on average if we consider the HFRI FoHF Composite index. Our selection of hedge funds even outperformed markets by 6.4%. Since 2008 and the GFC, rates have remained below 4% and hedge funds underperformed markets. Our selection of hedge funds underperformed markets by 2% even if the result is clearly better on a risk-adjusted basis.

The situation has changed and the 10Y, which recently reached 5%, could remain above 4% for some time. Inflation is likely to remain higher and huge deficits are expected going forward with the combination of deglobalization, energy transition, the US election and lack of buyers.

Hedge fund returns are a function of dispersion in equity markets, and higher rates help separate the winners from the losers. In addition, short-term zero rates had neutralized one of the key sources of returns for the strategy. Today with 5% rates, just because of keeping a relevant short book, a manager can basically pay for its own fees with interest gained on its shorts. Finally higher macro and market volatility, creates an environment rich with opportunities for active trading.

A hedge fund allocation on your client’s portfolio makes sense in this current investment régime.


Past performance is not indicative of future results. The views, strategies and financial instruments described in this document may not be suitable for all investors. Opinions expressed are current opinions as of date(s) appearing in this material only. References to market or composite indices, benchmarks or other measures of relative market performance over a specified period of time are provided for your information only. NS Partners provides no warranty and makes no representation of any kind whatsoever regarding the accuracy and completeness of any data, including financial market data, quotes, research notes or other financial instrument referred to in this document. This document does not constitute an offer or solicitation to any person in any jurisdiction in which such offer or solicitation is not authorized or to any person to whom it would be unlawful to make such offer or solicitation. Any reference in this document to specific securities and issuers are for illustrative purposes only, and should not be interpreted as recommendations to purchase or sell those securities. References in this document to investment funds that have not been registered with the FINMA cannot be distributed in or from Switzerland except to certain categories of eligible investors. Some of the entities of the NS Partners Group or its clients may hold a position in the financial instruments of any issuer discussed herein, or act as advisor to any such issuer.  Additional information is available on request.
© NS Partners Group

Active investment to finance an active retirement

Active investment to finance an active retirement

By actively managing their pension assets people can maintain their lifestyles and therefore ensure they have an active retirement

When we think about our retirement, we most often imagine being able to finally take advantage of the time no longer spent working to travel the world or devote more time to our interests or families. The 80s/90s dream, which allowed people to hope that the second pillar would enable them to lead the same lifestyle is now being undermined, however, by the protracted fall in yields and longer life expectancies. This could make our retirements, which we saw as well-deserved and care-free, a dreaded prospect and a source of anxiety.

More difficult markets on the horizon

The markets are admittedly hardly reassuring. Given the major geopolitical uncertainties, which are jeopardising the globalisation-based economic model that has ensured our prosperity for the last 30 years; the return of inflation, which is the mortal enemy of pensioners; the policy shift by central banks, which are announcing interest rate hikes that are bad news for bond and real estate investments; and relatively expensive equities, volatile and complex markets are to be expected in the years to come. This of course creates not insignificant risks for pensions.

The end of the 60/40 portfolio

In addition to increased volatility, we should also see a sharp fall in returns on conventional 60% equity/40% bond portfolios. The investment group AQR believes, for instance, that the real annual performance (after inflation) that might be hoped for from this type of portfolio is likely to be only 2.1% for the next 5 to 10 years, in other words half the historic average.

An investment approach more suited to negative headwinds

In such circumstances, it therefore seems vital to switch, for our pension assets, from mostly passive investing based on index-linked investments, to a more active investment style able to quickly adapt to changing conditions. The adopting of an investment strategy with a target absolute return is all the more important as it takes a long time to make back any capital lost, which is too often forgotten. Note, for example, that a 50% loss requires a 100% rise to get back to where you started, rather than a 50% rise, although this might seem more intuitive. Due to its flexibility, this “all-weather” investment approach allows investors to benefit from price exaggerations or any opportunities that may arise during periods of volatility. It also generates positive returns, even in opaque or bear markets.

Pension funds are (finally) taking an interest in alternative strategies

For a long time, alternative funds and conviction-based investing have been the preserve of high net worth private investors. This is underlined in a UBS study showing that family offices invest 43% of their assets in alternative instruments. As a result of better knowledge of the techniques used and greater transparency, institutional investors have being showing an interest over the past few years though, prompted by the successful example of the Yale University endowment funds, which allocate more than 75% of their assets to alternative strategies in general, including 23.5% allocated to hedge funds. That said, more risk-averse Swiss pension funds are limiting themselves to an average allocation of between 8% and 10%.

Active pension asset management solutions are available

Although it is difficult, at an individual level, for a person to influence the investment policy of their occupational pension fund (LPP), investment strategies that are more in keeping with their wishes can still be chosen through third pillar or vested benefits foundations. By looking beyond the lacklustre products offered by the big banks or insurance companies, people can indeed find dynamically-managed solutions that include significant allocations to alternative strategies, available from private banks and independent asset managers.

A considerable impact on your retirement

Why concern yourself with how your pension assets are managed? Quite simply because, given the particularly long time horizon for this type of investment, an apparently modest difference in annual returns will become a yawning gap over time. For example, after 10 years, an annual return that is 2% higher translates into +21.9% extra capital. After 20 years, the capital gain rises to +48.6%, and +81.1% after 30 years. This may have a very tangible impact on the capital and annuities available to you on your retirement. If you invested CHF 1 million in a vested benefits product, this would equate to CHF 810,000 after 30 years, increasing your annuities by CHF 44,000 assuming a 5.4% conversion rate.

And these thousands of extra francs each month could mean the difference between a retirement marred by financial uncertainty and care-free golden years when you can finally make the most of your free time!

July General Market Comments

July General Market Comments

« Whose Side Are You On? » – Matt Bianco, 1984

Are you on the optimists’ or the pessimists’ side? Or rather on the side of those who have no idea?

So far, 2022 tends to plead in favour of the pessimists, but optimists could argue that July 2022 was the best month for the S&P 500 since November 2020 (when Pfizer-BioNTech announced they had a vaccine against Covid), and those who have no idea could point out that finally markets were roughly flat for June-July 2022, as June was a dreadful month.

There are many things to factor in, and all of them give arguments to one side or another: inflation is high, but expected to normalize, especially since Central Banks seem keen on tackling it rapidly; geopolitics are a mess with not only the conflict between Russia and Ukraine, but also the heightened tensions between the US and China regarding Taiwan; corporate and private debt does not seem to be a source of problems today, but Government debt across developed markets is immense; earnings reports have been surprisingly good so far, but they are expected to slow down significantly going forward; commodities do not move in sync, but there seems to be a growing threat from Russia about gas deliveries in Europe for this winter, triggering skyrocketing gas prices. With all this happening at the same time, it is not easy to choose your side and it’s not surprising to see numerous experts change their minds, depending on the most recent events.

Buoyed by convincing earnings releases and some more risk appetite, equity markets soared in July: the MSCI World gained +7.86%, the S&P 500 +9.11%, the Nasdaq +12.55%, the MSCI Europe +7.52% and the Topix +3.71%. The only detractor was Emerging Markets, down 0.69%. As nominal and real yields fell, Growth outperformed Value with a +11.51% return for the MSCI World Growth versus +4.44% for its Value counterpart.

In such a risk-prone month, Credit also rose (+3.06% for the Itraxx Crossover), and Government yields fell (-36 bps for the US 10 year, -52 bps for Germany); Gold and Oil receded by 2.29% and 6.75% respectively, and the Euro fell further against the dollar (-2.51%), weakened by the possible looming energy crisis in Europe and an unfavourable interest rate differential.

That’s it for this month’s Market Comments, stay tuned, markets never skip a beat.


Past performance is not indicative of future results. The views, strategies and financial instruments described in this document may not be suitable for all investors. Opinions expressed are current opinions as of date(s) appearing in this material only. References to market or composite indices, benchmarks or other measures of relative market performance over a specified period of time are provided for your information only. NS PARTNERS SA provides no warranty and makes no representation of any kind whatsoever regarding the accuracy and completeness of any data, including financial market data or other financial instruments referred to in this general comment. This document does not constitute an offer or solicitation to any person in any jurisdiction in which such offer or solicitation is not authorized or to any person to whom it would be unlawful to make such offer or solicitation. Any reference in this document to specific securities and issuers are for illustrative purposes only, and should not be interpreted as recommendations to purchase or sell those securities. References in this document to investment funds that have not been registered with the FINMA cannot be distributed in or from Switzerland except to certain categories of eligible investors. Some of the entities of the NS Partners Group or its clients may hold a position in the financial instruments of any issuer discussed herein, or act as advisor to any such issuer. Additional information is available on request. © NS Partners Group

June General Market Comments

June General Market Comments

« I want to know » – Adriano Celentano

I want to know… we all want to know: are we headed into a recession, or a slowdown? Have valuations sufficiently shrunk for this type of economic environment, or should we expect more pain ahead? Are fixed-income markets right when they bet on inflation coming back to 2.5% five years from now, or is core inflation higher and stickier? Are Central Banks still behind the curve, or ahead  now that economic activity seems more fragile? Will Russia and Ukraine agree one some kind of ceasefire soon, or will this conflict last for years as many military experts warn?

So many questions and so little clear answers indeed. We would like to know, but we don’t.

Uncertainty is the biggest handicap for financial markets to perform correctly and/or to behave smoothly; this is the reason why markets are so challenging and frustrating this year. The only strong message we receive from equity markets is that a severe slowdown, or a recession, is underway: only defensive sectors resist to the meltdown, and recently we have seen Energy and Materials, two good sectors so far this year, crack as well. Fixed-income markets indicate a mixed outlook: Government bonds yields are still quite high (read: low probability of a recession), but  Credit suffers, as witnessed by the Itraxx Crossover which lost 5.2% in June, and this is a signal of economic trouble ahead. Commodity markets are difficult to interpret: if a recession was due, they should crater, but they don’t, due to obvious supply constraints.

The MSCI World sank 8.8% in June, the S&P 500 8.4%, the MSCI Europe 7.9% the MSCI Emerging Markets 7.2%, and if Japan seemed to resist with a 2.2% drawdown for the Topix, this has to be mitigated by the dismal performance of the Yen (down 5.5% versus the dollar in June, 17.9% year to date!).

Oil fell 7.8%, more or less like Equity markets, Gold abandoned 1.6%, and Government bonds yields rose again: +17 bps for the US, +21 bps for Germany and +14 bps for Italy.

That’s it for this month’s Market Comments, stay tuned, markets never skip a beat.


Past performance is not indicative of future results. The views, strategies and financial instruments described in this document may not be suitable for all investors. Opinions expressed are current opinions as of date(s) appearing in this material only. References to market or composite indices, benchmarks or other measures of relative market performance over a specified period of time are provided for your information only. NS PARTNERS SA provides no warranty and makes no representation of any kind whatsoever regarding the accuracy and completeness of any data, including financial market data or other financial instruments referred to in this general comment. This document does not constitute an offer or solicitation to any person in any jurisdiction in which such offer or solicitation is not authorized or to any person to whom it would be unlawful to make such offer or solicitation. Any reference in this document to specific securities and issuers are for illustrative purposes only, and should not be interpreted as recommendations to purchase or sell those securities. References in this document to investment funds that have not been registered with the FINMA cannot be distributed in or from Switzerland except to certain categories of eligible investors. Some of the entities of the NS Partners Group or its clients may hold a position in the financial instruments of any issuer discussed herein, or act as advisor to any such issuer. Additional information is available on request. © NS Partners Group

Chart of the Month – Nowhere to run, nowhere to hide

Chart of the month – Nowhere to run, nowhere to hide

chart of the monthThose of you that have aged well will remember the Billboard Hot 100 single “Nowhere to Run” by Martha Reeves & The Vandellas which was released in 1965 by Motown and copied & remixed by many such as The Isley Brothers, Laura Nyro, Michael Bolton and The Commitments (for you younger folks out there). At the time the 60% equities / 40% bonds (“balanced”) portfolio had already been around for over 10 years, invented by Nobel prize winner Harry Markowitz. The classic 60/40 portfolio has delivered an annualized return of 4.54% over the last 28 years with a Sharpe of 0.44. Fast forward to today and the conventional model which has been so successful historically has suddenly been turned on its head and questioned as the benchmark index was down 14.4% YTD as of mid-May! This is the worst synchronized decline for equity and fixed income benchmarks in history. So, have hedge funds finally earned their place at the dinner table? Not the case this year for most of the successful equity long short names in the industry, irrespective of their geographical focus.

Exactly two years ago, we wrote a piece titled “Survival of the Fittest” which was to be the blueprint for the enhancement of our multi-strategy low volatility mandate which had been running for over 20 years. A year later we wrote the sequel “In Pursuit of Looking Sharpe” after having implemented the changes outlined in our blueprint by adding a number of multi-PM platforms to the portfolio. In summary, the success of the multi-PM model is predicated on their ability of imposing strict stop-loss guardrails in order to prevent drawdowns in addition to being the most efficient allocators of capital to differentiated sources of alpha. Furthermore, multi-PM platforms are increasingly working with external managers enabling them to outperform their peers and produce higher Sharpe ratios (in addition to avoiding high acquisition costs associated with the traditional turf wars between the larger funds). Fast forward to today and as they say “the proof is in the pudding” following two years of live track record in the enhanced mandate. And thus, we truly have an all-weather approach as an alternative to fixed income that enables you to sleep well at night without having to worry about the extreme intra-day moves we have been witnessing of late.

This month’s chart illustrates the sum of all the monthly drawdowns of the MSCI World Index over the last 2 years stacked up against the returns of our multi-strategy low volatility mandate during the same periods. So far, we are pleased with the live crash-test results with a spread of 33.75%, thus making it a viable “alternative” to traditional portfolios. This year Value, Growth and Momentum have been the biggest driver of single stock volatility (and unfortunately Quality has become correlated to Momentum recently) with many of the largest and most successful managers in the equity long / short space witnessing their largest drawdowns of their investment careers. In striking contrast, the equity long / short managers within the multi-PM platforms have been able to perform well due their factor awareness (if not factor neutrality in some cases) together with their low net market exposure.

Remember this famous quote: Crises take much longer to arrive than you believe and they happen much faster than you thought they could (the late Rudi Dornbusch – the economist who graduated from the University of Geneva)!


Past performance is not indicative of future results. The views, strategies and financial instruments described in this document may not be suitable for all investors. Opinions expressed are current opinions as of date(s) appearing in this material only. References to market or composite indices, benchmarks or other measures of relative market performance over a specified period of time are provided for your information only. NS Partners provides no warranty and makes no representation of any kind whatsoever regarding the accuracy and completeness of any data, including financial market data, quotes, research notes or other financial instrument referred to in this document. This document does not constitute an offer or solicitation to any person in any jurisdiction in which such offer or solicitation is not authorized or to any person to whom it would be unlawful to make such offer or solicitation. Any reference in this document to specific securities and issuers are for illustrative purposes only, and should not be interpreted as recommendations to purchase or sell those securities. References in this document to investment funds that have not been registered with the FINMA cannot be distributed in or from Switzerland except to certain categories of eligible investors. Some of the entities of the NS Partners Group or its clients may hold a position in the financial instruments of any issuer discussed herein, or act as advisor to any such issuer.  Additional information is available on request.

© NS Partners Group

May General Market Comments

May General Market Comments

“Take the money and run”– The Steve Miller Band, 1976.

Are market participants in a “Take the money and run” mood in 2022? Perhaps, because on top of being extremely difficult this year, broad financial markets have shown high levels of volatility, which have been blatant in up moves like in down moves. May was the perfect illustration of this, and not only for Equities: the MSCI World did a round trip from -6.8% to + 8.1% to end up the month down a meagre 0.16%, US 10-year yields went from 2.91% to 3.20% and then all the way down to 2.7% and finished at 2.86%, WTI began at $105, travelled down to $98 and up to $ 118… well, you see the picture: sudden and significant gyrations, greed and fear in action at the same time.

This makes investors’ life uneasy. Temptation is high to take quick profits when there are some, and to sell rapidly on the downside in order to limit losses. Whatever the direction markets are headed to, people tend to take the money and run, even at a loss.

Sentiment is quite logically mixed: between rising Commodity prices and inflationary pressures, hawkish Central Banks, fears of a serious slowdown, not to say a recession, and geopolitical tensions, all financial markets are complicated. Will corporate earnings be jeopardized? Will interest rates stop climbing? When will Commodity markets start to ease? Why does Gold perform so poorly in such an environment?

After mid-May’s carnage, there’s some satisfaction to see muted drawdowns for equity markets, thanks to a strong rally in the second half of the month: the S&P 500 even gained 1 basis point, the Nasdaq abandoned 1.65%, the MSCI Europe 1.48%, but both the Japanese Topix and the MSCI Emerging Markets were up (+0.69% and +0.14% respectively). Value still prevailed and added 1.73% while Growth lost 2.39%. Yields moved up in Europe (+18 bps for the 10-year Bund and +34 bps for the Italian 10-year BTP) but slightly fell in the US (-10 bps for the US 10-year Treasury). Credit was mostly flat, Gold fell 3.14% and Commodities were up 2.68%, once again driven by Oil (+9.53% for the WTI).


Past performance is not indicative of future results. The views, strategies and financial instruments described in this document may not be suitable for all investors. Opinions expressed are current opinions as of date(s) appearing in this material only. References to market or composite indices, benchmarks or other measures of relative market performance over a specified period of time are provided for your information only. NS PARTNERS SA provides no warranty and makes no representation of any kind whatsoever regarding the accuracy and completeness of any data, including financial market data or other financial instruments referred to in this general comment. This document does not constitute an offer or solicitation to any person in any jurisdiction in which such offer or solicitation is not authorized or to any person to whom it would be unlawful to make such offer or solicitation. Any reference in this document to specific securities and issuers are for illustrative purposes only, and should not be interpreted as recommendations to purchase or sell those securities. References in this document to investment funds that have not been registered with the FINMA cannot be distributed in or from Switzerland except to certain categories of eligible investors. Some of the entities of the NS Partners Group or its clients may hold a position in the financial instruments of any issuer discussed herein, or act as advisor to any such issuer. Additional information is available on request. © NS Partners Group