Chart of the Month – How to assess the risk of an equity portfolio today?

How to assess the risk of an equity portfolio today?
Source : Cantillon, FactSet

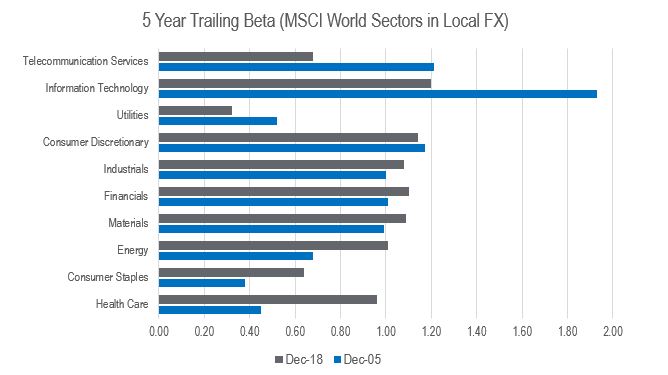
Calculating the beta has traditionally been a good way to assess the risk associated to a stock in a portfolio. The beta measures the sensitivity of the stock price to a market index. The higher the beta, the higher the amplitude of the stock price with the market on both long and short sides. In theory, having a portfolio of low beta stocks should protect you more in terms of downside during a market correction.

The issue is that, as shown in the table above, the 5 Year Trailing Beta for most sectors has significantly changed over the last 3 years. With technology disruption in action in almost all parts of the economy, some companies which belong to defensive sectors are now more vulnerable with less strong barriers to entry. Healthcare and Consumer Staples have seen the highest increase in terms of beta whereas Telecommunication Services appear as among the less risky sectors to invest in today!

The reality is that beta is only one statistic to look at and other parameters like factors and styles have more explanatory power to performance today. Momentum was the best performing factor by far until the last quarter of 2018 which saw a huge reversal. To make the story even more complex, the beta of factors are also less stable over time and record factor correlation explains the poor returns of quantitative and risk premia managers last year.

At Notz Stucki, we are well aware of factor exposures and correlations when managing our equity portfolios. But the first question we ask ourselves when we analyze a company is do we want to own this business and is it able to generate good long-term compounding returns over the years.
A (deep) contrarian view: Buy the basket of top holdings in US Hedge Funds

BUY THE BASKET OF TOP HOLDINGS IN US HEDGE FUNDS

CURRENT SITUATION

Source: Bloomberg

2016 has been a very tough year for active managers, especially in the equity US market (both hedge funds and long only funds). From 31-Dec-15 to 30-April-16, the SP500 NTR has gained 1.73% whereas the Tremont Long-Short Index has dropped 4.52%. Several reasons may explain this:

• Metals and oil prices “unexpectedly” rebounded very quickly and the basic resources companies outperformed dramatically the market. Hedge fund managers were underexposed or short these sectors.
• World economic growth data disappointed again, long-term rates dropped and as a consequence the low volatility interest rate sensitive sectors (consumer staples, utilities, telco services) also outperformed. Hedge fund managers were underexposed or short these sectors.
• Momentum factor has not performed this year, and hedge funds are typically momentum oriented.

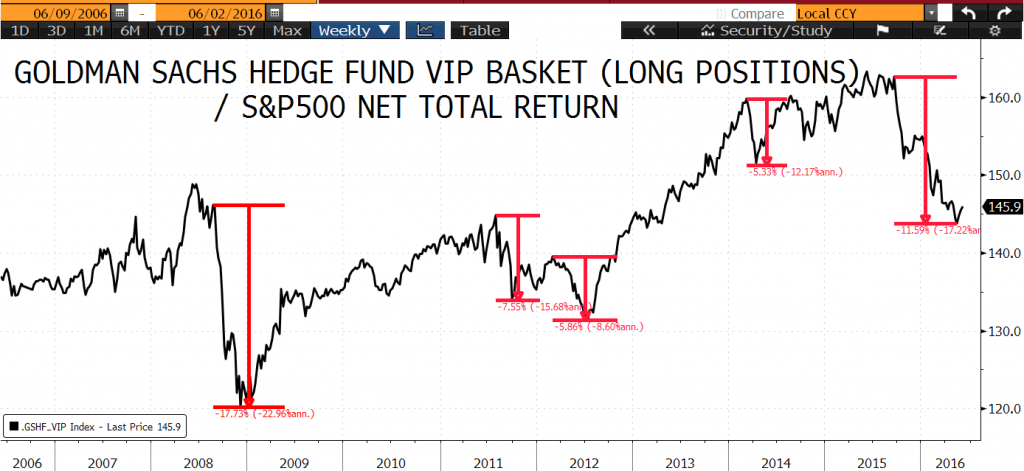
On a quarterly basis, Goldman Sachs update a list with the 50 stocks that most frequently appear among the largest 10 holdings of hedge funds. This list is called GSTHHVIP, from now on, the BASKET. In the graph above you can see the relative performance of the BASKET versus the S&P500 Net Total Return. This has been the second worst period for the BASKET (relative to the index) for the last 10 years with a relative underperformance of 11.5% during the last 11 months.

EXPECTATIONS

The “unexpected” sector rotation that took place during the first 5 months of the year has started to revert and fundamentals are becoming (again) more important than technical factors.
Typical low growth or very cyclical companies are starting to underperform whereas more stable or growth companies like information technology or health care have started to outperform.
Correlation between stocks and correlation between sectors have decreased to lower levels, typical symptoms of a “more rational” market.
Hedge funds, though expensive sometimes, are still the most talented people in the industry and after periods of underperformance they tend to recover (See chart).
From the sector point of view the basket is overweighting Consumer Discretionary and Health Care companies which is in line with our market view.
From the technical point of view, the MACD signal (indicates changes in a security’s underlying price trend, so you can identify turning points) is giving a very strong indication to buy the BASKET index relative to the SP500

RECOMMENDATION

Buy the BASKET and short the SP500. This trade has a historical volatility of about 6%, so it can be implemented with 2 times leverage. Historically, the beta of this basket has been 0.13.
Time horizon for this trade: In the past, it took between 3 months to 9 months to grasp the profits of this trade.
Why do not make a trade long the HF top holdings and short the HF less owned stocks? Because the least owned stocks have outperformed the market in the past (surprise, surprise!)
Why do not make a trade similar to this with the overweight positions of the mutual fund industry? Because the data is only 4 years old and the relative performance has historically be less important.