Chart of the Month – The mystery of stock prices falling despite earnings increasing

The mystery of stock prices falling despite earnings increasing
Source: Notz Stucki

“Millions saw the apple fall, but Newton asked why.”
Bernard Baruch

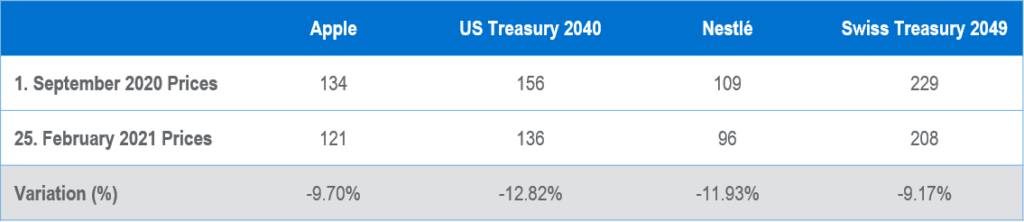
Apple and Nestlé, among many popular large-cap stocks did not perform well since September 2020, despite a rising broad market and favorable earnings releases. Between September 2020 and February 2021, Apple fell close to 10% and Nestlé 12%. Although the most important thing for a stock to perform well over the long term is by far its earnings growth, sometimes, shorter term, this isn’t sufficient to compensate for the other most important factor when it comes to asset prices in general: interest rates. This love and hate relationship between equities and interest rates should, in theory, be very simple to assess: falling interest rates are good for equities as it magnifies future flows, while rising interest rates do the opposite. But this has not been the case all the time; popular “risk-parity” strategies were playing against the maths logic as they were long fixed-income and equities in order to have a protection on possible equity downside thanks to supposedly good returns from bonds when it happens. But this is not what the maths tell you: if the discounting factor (i.e. interest rates) moves higher, then the price of your asset, all else things equal, falls.

And this is precisely what happened during the last 6 months (for some listed companies), as the discounting factor rose quite sharply (US 10 year yield went from 0.7% to 1.47%, 20 year yield from 1.24% to 2.15%). Guess what, maths worked perfectly well this time as long duration equities fell, almost in line with the fall in bond prices like the table above highlights. Apple’s Price Earnings Ratio went from 34 to 27 times 2021 estimated earnings, for Nestlé it moved from 26 times to less than 23. Here’s the proof that although higher yields do not really affect the business of these companies, it definitely has an influence on their valuations. But there are equity sectors which show an inverted correlation compared to what the maths say. First and foremost, financials, the most hatred sector of the last decade. Rising interest rates is good for banks and insurance companies. More broadly, cyclical sectors tend to be shorter duration assets than growth and defensive sectors and logically outperform when yields move to the upside. The very good performance from cyclical sectors since interest rates started to move up was the reason why indices were able to grind higher. This is why a balanced approach in terms of sectors is important. We don’t know if yields will keep on rising, stall or fall; but we do know that building a portfolio of good companies, whatever their sectors, with a nice equilibrium between Value/Growth and Cyclicals/Defensives is the surest way to deliver appreciable returns over the long term.


Past performance is not indicative of future results. The views, strategies and financial instruments described in this document may not be suitable for all investors. Opinions expressed are current opinions as of date(s) appearing in this material only.

References to market or composite indices, benchmarks or other measures of relative market performance over a specified period of time are provided for your information only. Notz, Stucki provides no warranty and makes no representation of any kind whatsoever regarding the accuracy and completeness of any data, including financial market data, quotes, research notes or other financial instrument referred to in this document.

This document does not constitute an offer or solicitation to any person in any jurisdiction in which such offer or solicitation is not authorized or to any person to whom it would be unlawful to make such offer or solicitation. Any reference in this document to specific securities and issuers are for illustrative purposes only, and should not be interpreted as recommendations to purchase or sell those securities. References in this document to investment funds that have not been registered with the FINMA cannot be distributed in or from Switzerland except to certain categories of eligible investors. Some of the entities of the Notz Stucki Group or its clients may hold a position in the financial instruments of any issuer discussed herein, or act as advisor to any such issuer.

 Additional information is available on request.

© Notz Stucki Group
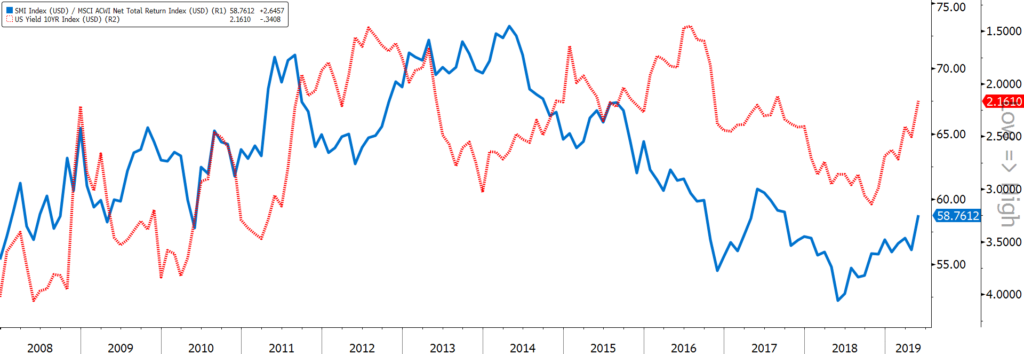
Chart of the Month – Something wrong? Eat chocolate.

Chart of the month

Something wrong? Eat chocolate.

Source: Bloomberg, Notz Stucki

The month of May has come with its various news, we experienced the first month in negative territory since December 2018. We had however started the year well with four consecutive positive months. May brings some questions to investors: Should I sell? Do I have to worry? … What can I do?

One simple action would be to increase exposure to defensive stocks. Find and invest in companies with, among others, stable earnings, low beta and constant dividend. By definition, the Swiss market has demonstrated a defensive nature over time. Links exist between movements on the US yields and world equity markets, the impact could be more or less significant. In the graph above, over an eleven-year window, we find the 10-year US yield on an inverted scale and the ratio Swiss market over the MSCI All Country World Index. The trend has been reversed since mid-2018: the Swiss market outperforms the world index. We notice that lately when yields go down in US (in our example the 10-year) Swiss market performs and since mid-2018 much better in relative terms.

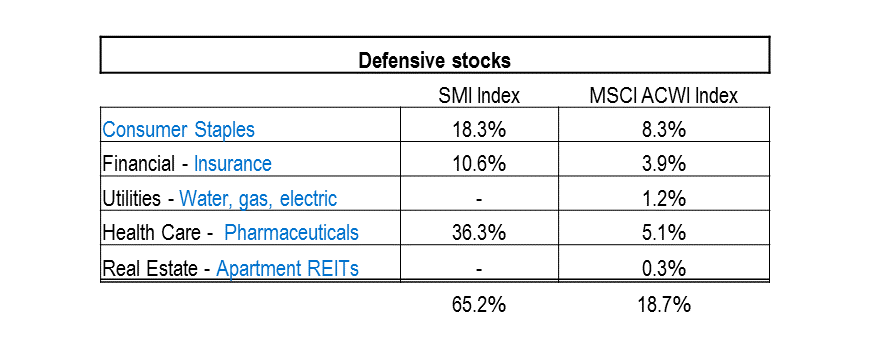
One step further, what is the actual composition of the Swiss market? Is it really defensive compared to MSCI All Country World Index? Analysis focused on the major Swiss Index: SMI Index. We selected the sectors and subsectors that have a defensive nature, this means Consumer Staples, Insurance, Water, Gas and Electric-related companies, Apartment REITS and Pharmaceuticals, excluding Biotech companies. Results are straightforward: Swiss market detains more Consumer Staples (18.3% against 8.3%), more Insurance companies (10.6% against 3.9%), more Pharma (36.3% against 5.1%) than the MSCI All Country World Index and there is no exposure to Utilities – Water, Gas and Electric-related companies or Apartment REITS. The large Swiss exposure to Staples and Pharma through Nestlé, Roche and Novartis is well known, however, the exposure to insurance and therefore the overexposure to the world index is probably not as well-known.

To conclude, more than half of the Swiss market, i.e. 65.2% is composed by defensive stocks versus 18.7% for the World Index. If we extend the analysis to the SPI Index, as the Swiss market is full of specific and niche companies, results are similar. We do not specially expect a downturn and we are not ready to sell but to add defensive in one’s portfolio can be an attractive direction. Last month, Swiss stocks demonstrated resilience with a scant negative performance of -2.52% bringing the SMI’s performance to 12.99% YTD. Last but not least, it is difficult to ignore the very good performance of the king of Swiss Staples: Nestlé, at +24.75% YTD.

Chart of the Month – Swiss Made

Swiss Made

Source: Bloomberg. Notz Stucki
Source: Bloomberg, Notz Stucki

The Swiss equity market is a strange animal which exhibits pretty unique characteristics: in a small country in terms of size and population, no less than 4 mega multinationals are listed on the stock market, and completely distort the average metrics traditionally used to assess the attractiveness of an index. The famous 4 are Nestlé, Novartis, Roche and UBS which, combined, reach close to CHF 760 bln in market cap!

As a reminder, there are three indices for the Swiss market:

1) The SMI, composed of the largest and most liquid 20 companies.
2) The SPI, representing the broad market and composed of 212 companies.
3) The SPIEX, which is simply the SPI without the 20 stocks of the SMI.

Table Swiss Made

As is often the case, there are many wonders to discover when looking under the surface. The universe of Swiss listed companies comprises many world leaders in niche products or industries, with a wide variety of specialties. Do a lot of non-Swiss investors know something about Sonova, or Belimo, or Forbo Holding? Certainly not, despite the fact that these three companies are integrated world leaders: hearing systems for Sonova, Belimo for air-volume controls and Forbo for flooring and moving systems. And these are just three examples among many others.

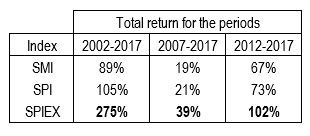
While we don’t question the strong positions of the big leaders, we think investors interested in Swiss equities would lose the most attractive part of the market by focusing on the SMI. Historical performances strongly confirm this view: the SPIEXX index has outperformed the SPI and the SMI over 5, 10 or 15 years by a wide margin. Let’s also remember that compared to other markets, these performances have been done in CHF, by far the best currency in the world.

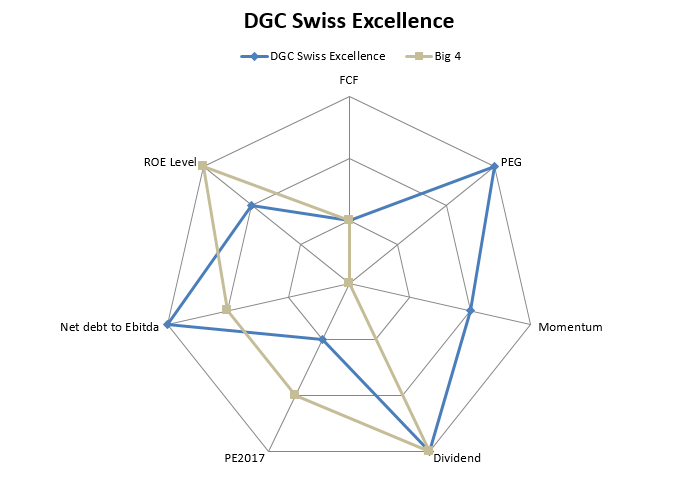
So when we manage our Swiss equity fund DGC Swiss Excellence, we pay attention to these smaller companies which are decisive contributors to investors’ returns over time. Although we invest into the larger companies, our portfolio also holds 80 companies which are not in the SMI Index. And they add value: as we focus on Price Earnings Growth, Earnings Momentum, Free Cash Flow Generation and low levels of debt, the chart of the month shows that our portfolio shows better or identical attributes than the “Big 4” for these metrics. And there’s no reason to believe it will reverse any time soon!