Quarterly Investment Review – Q3 2022
Quarterly Investment Review – Q3 2022
Some sombre clouds have darkened the global economic outlook. The energy crisis is making headline news daily, and creating considerable political trouble. China’s economy continues to suffer due to their zero Covid policy and the weakening of its real estate market. Inflation is running at levels in the West not seen for decades. Then at the end of the quarter a radical and poorly communicated budget statement in the UK led to an alarming collapse in sterling and UK gilts. So, it is not surprising that the markets have been under pressure. Equities had seen the worst first half to the year since 1962. By the end of the third quarter the World Index was down 26%, and the Nasdaq was down 32%. Technology having been far and away the best performing sector in the last decade, meant that a lot of money was crowded there, so it has suffered even more than the general index. The bond market has performed even worse, with some analysis showing 2022 being the worse year for bonds since 1788 and 1865. It is an environment that begs a lot of questions that are not easy to answer. How will the war in Ukraine progress? Can European solidarity with Ukraine survive a cold winter? How in control of its real estate sector is China, remembering that Chinese real estate is now the largest financial asset in the world? What happens if Central Banks run out of room to raise rates due to their national debt situation, but inflation remains high? Put another way how would Central Banks respond to an inflationary depression? That could be caused by continued high prices of food and energy, and disrupted supply chains.
Many of these uncertainties come down to inflation and the cost of living. Some price rises are due to the lingering after effects of Covid with shortages in critical components, such as semi-conductors, exacerbated by China’s lockdown. Russia’s invasion of Ukraine represents a completely different scale of disruption. Europe’s reliance on Russian gas, for example, represents a colossal strategic mistake. How can European economies thrive when they undergo a five to ten-fold increase in electricity prices?
Click here to download the full document.
Past performance is not indicative of future results. The views, strategies and financial instruments described in this document may not be suitable for all investors. Opinions expressed are current opinions as of date(s) appearing in this material only. References to market or composite indices, benchmarks or other measures of relative market performance over a specified period of time are provided for your information only. NS Partners provides no warranty and makes no representation of any kind whatsoever regarding the accuracy and completeness of any data, including financial market data, quotes, research notes or other financial instrument referred to in this document. This document does not constitute an offer or solicitation to any person in any jurisdiction in which such offer or solicitation is not authorized or to any person to whom it would be unlawful to make such offer or solicitation. Any reference in this document to specific securities and issuers are for illustrative purposes only, and should not be interpreted as recommendations to purchase or sell those securities. References in this document to investment funds that have not been registered with the FINMA cannot be distributed in or from Switzerland except to certain categories of eligible investors. Some of the entities of the NS Partners Group or its clients may hold a position in the financial instruments of any issuer discussed herein, or act as advisor to any such issuer. Additional information is available on request. © NS Partners Group
Chart of the Month – Conversation with an energy L/S portfolio manager
Conversation with an energy L/S portfolio manager
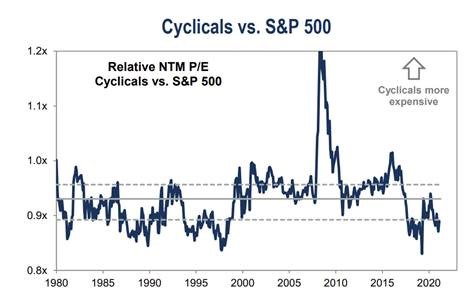
The Global Energy Sector is still very cheap vs history – which differs from the broader market (charts below which compare relative valuations between different sectors and the broader market, Energy is still trading at 11.8x P/E, a discount to historical averages vs. the broader market trading at ~20x, a premium).
So potentially plenty of room for relative multiples to normalize value vs. growth, especially given the focus from energy management teams on return on and return of capital (the space is set to see >20% ROCE over the coming years, which competes with any market sector, as well as in some cases double digit return of capital yields). This compares to other ‘stimulus driven’ sectors where there is a pull forward of demand – ie, cons discretionary and info tech which are still elevated vs. historical valuations.

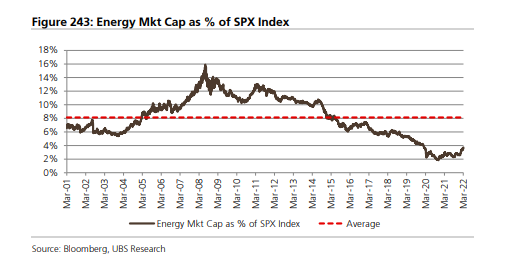
The chart below illustrates Energy Market Cap as percent of S&P, still close to the lows: 4% vs. 20 year average of 8%. This shows the degree of valuation disconnect vs. both historical measures and the broader market.
Past performance is not indicative of future results. The views, strategies and financial instruments described in this document may not be suitable for all investors. Opinions expressed are current opinions as of date(s) appearing in this material only. References to market or composite indices, benchmarks or other measures of relative market performance over a specified period of time are provided for your information only. NS Partners provides no warranty and makes no representation of any kind whatsoever regarding the accuracy and completeness of any data, including financial market data, quotes, research notes or other financial instrument referred to in this document. This document does not constitute an offer or solicitation to any person in any jurisdiction in which such offer or solicitation is not authorized or to any person to whom it would be unlawful to make such offer or solicitation. Any reference in this document to specific securities and issuers are for illustrative purposes only, and should not be interpreted as recommendations to purchase or sell those securities. References in this document to investment funds that have not been registered with the FINMA cannot be distributed in or from Switzerland except to certain categories of eligible investors. Some of the entities of the NS Partners Group or its clients may hold a position in the financial instruments of any issuer discussed herein, or act as advisor to any such issuer. Additional information is available on request.
© NS Partners Group
Chart of the Month – The contribution of alternative investments to asset allocation
The contribution of alternative investments to asset allocation
The debate around inflation is raging these days. While the arguments in favor of temporary inflation clash with those advocating the return of higher structural inflation, it is clear that the narrative of the US central bank has considerably evolved in recent months. To the point that some analysts are now wondering if the Fed simply made a major error of judgment that could lead to serious corrections in financial markets. In the short term the Fed is so “behind the curve” that it has no other choice but to start raising its key rates in March. It is also surprising to see such divergence between DM and EM central banks which already started their rate hike cycle for months. As we are writing these lines, the Fed is still injecting liquidity into markets! However, inflation is mainly a US problem today (with the exception of specific cases such as Turkey and its unorthodox monetary policy, or significant increase in European energy prices) with the combination of several factors: ultra-accommodative monetary policy, unprecedented fiscal stimulus, strong economic growth, excess household savings and record low unemployment rate leading to upward pressure on wages. On top of that, we have the China factor. Indeed, the “zero COVID” policy pursued by the Chinese authorities, coupled with relatively low herd immunity and a less effective vaccine, are causing repeated partial shutdowns of the Chinese economy. The impact on supply chains, particularly for the production of consumer goods for Western countries, is being felt. While headline inflation is quite low in China, inflation on production costs is up more than 10% year-on-year.
This situation will push the central banks of developed countries, and first and foremost the Fed, to raise rates very quickly. The rate and amplitude are difficult to predict, but the direction is clear. There are several consequences in terms of asset allocation and portfolio managers can’t remain insensitive to this change in the macroeconomic environment.
- Regarding equities, value sectors are now significantly outperforming growth sectors, which had been the big winners of the pandemic and the last decade. Sector exposures will be key in such a macro-driven market environment going forward. With more than 10 rotations in 2021, equity markets have not been so easy to navigate. The performance of the indices can mask certain realities and the Nasdaq, which gained 22% in 2021, would only be up 9% in its 5 largest capitalizations. It seems to us that a “blended” approach with a selection of good quality companies is the right approach at this stage.
- Regarding bonds, it seems almost impossible to expect a decent return without taking risks for which we are not paid for. The period of free money has lasted so long that certain economic realities will resurface with the end of this era and we don’t see why private debt markets would be immune to the rise in rates.
Over the past 10 years, the classic 60/40 portfolio model, i.e. 60% allocation in equities and 40% in bonds, has generated satisfactory risk-adjusted performance, but we can legitimately doubt that it will be the case for the coming months. In this context, “relative value” strategies seem particularly interesting to consider. Their objective is to deliver consistent performances, decorrelated from markets, with low volatility. There are 2 main relative value strategies:
- Multi-strategy multi-PM platforms, which tend to be large by assets and able to attract the best traders in the world and
- Smaller managers who implement niche strategies on specific market segments. With an in-depth knowledge of this investment universe, an efficient selection process and capacity to invest with the best managers, NS Partners has been able to build robust portfolios, which have delivered “all weather” returns for more than 20 years.
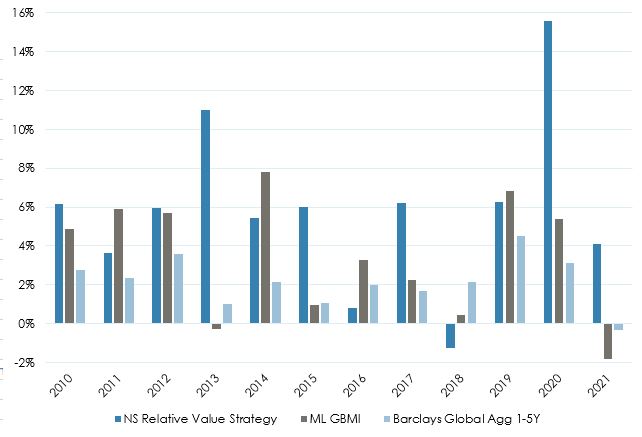
The chart above shows annual performances of the NS “relative value” strategy compared to the BoA-ML Global Bond and Barclays Global Aggregate 1-5Y bond indices:
- Over the past 12 years, the strategy has posted a net average annual performance of +5.8%, compared to +3.4% and +2.2% for the two indices.
- The annualized volatility of the strategy is only 3.1% and shows no correlation with bond markets.
- Even more interesting, when we consider the 10 months when the US 10-year interest rate increased the most, the strategy posted an average performance of +0.96% while the BoA-ML Global Bond index posted exactly the same average performance in absolute value but with a negative sign, -0.96%!
And if you are not convinced by the past, consider the present. The Bloomberg 60/40 index lost 4.2% in January 2022 whereas the NS RV strategy is estimated to be slightly down for the month.
Past performance is not indicative of future results. The views, strategies and financial instruments described in this document may not be suitable for all investors. Opinions expressed are current opinions as of date(s) appearing in this material only. References to market or composite indices, benchmarks or other measures of relative market performance over a specified period of time are provided for your information only. NS Partners provides no warranty and makes no representation of any kind whatsoever regarding the accuracy and completeness of any data, including financial market data, quotes, research notes or other financial instrument referred to in this document. This document does not constitute an offer or solicitation to any person in any jurisdiction in which such offer or solicitation is not authorized or to any person to whom it would be unlawful to make such offer or solicitation. Any reference in this document to specific securities and issuers are for illustrative purposes only, and should not be interpreted as recommendations to purchase or sell those securities. References in this document to investment funds that have not been registered with the FINMA cannot be distributed in or from Switzerland except to certain categories of eligible investors. Some of the entities of the NS Partners Group or its clients may hold a position in the financial instruments of any issuer discussed herein, or act as advisor to any such issuer. Additional information is available on request.
© NS Partners Group
Chart of the Month – Shifting gears in the equity markets
Shifting gears in the equity markets

The two main drivers of equity markets are liquidity (provided by the Central Banks) and earnings (provided by corporations). When both drivers are favourable, equity performance is extremely good. In the graph above you can see two very good periods reflecting this:
- (ORANGE): Earnings recovered very fast after the Great Recession of 2008 and also after the initial stages of the Covid pandemic.
- (BLACK): FED rates tumbled to almost 0% after the Great Recession of 2008 and again during the Covid pandemic.
- (BLUE). The SP500 performed extremely well when the two tail winds blew in the same direction: 16.5% CAGR during the 2009-13 period, and 30% CAGR since April 2020.
But the party cannot last forever, and Central Banks will start tightening and withdrawing liquidity once the economy recovers. The graph shows this situation during the period of Jun13 to Dec18 when the FED started tapering, and then hiking rates. This was an earnings driven market where profits continued to increase while liquidity was reduced by Central anks. Still the equity market managed to achieve a respectable 9% CAGR performance.
Where are we now? Thanks to the combined efforts of the scientific world (vaccines), Central Banks (rate cuts + bond purchases) and Governments (huge fiscal packages) the world economy has recovered well, so the economy no longer needs assistance from Central Banks. They have either started to reduce liquidity (Bank of England, Norway…), or will do so during 2022 (FED, ECB, …)
WHAT CAN WE EXPECT FOR 2022?
- (BLACK): The FED will gradually stop buying bonds by April 2022; during 2022 the FED rates will likely increase 3 times, by 0.25% each time. This will be a headwind for the market. Remember the old saying: “Don’t fight the FED”.
- (ORANGE): Earnings have recovered very fast in 2021 and will continue to increase in 2022 and 2023, but at a lower rate of 10% according to IBES estimates, which is much less than the 25% increase that we enjoyed in 2021.
- (BLUE). The SP500 will likely rise again in 2022 but with the headwinds from the Central Banks and the lower EPS growth, the market will probably shift down a gear to deliver a return of 5% to 10% performance during 2022.
Past performance is not indicative of future results. The views, strategies and financial instruments described in this document may not be suitable for all investors. Opinions expressed are current opinions as of date(s) appearing in this material only.
References to market or composite indices, benchmarks or other measures of relative market performance over a specified period of time are provided for your information only. NS Partners provides no warranty and makes no representation of any kind whatsoever regarding the accuracy and completeness of any data, including financial market data, quotes, research notes or other financial instrument referred to in this document.
This document does not constitute an offer or solicitation to any person in any jurisdiction in which such offer or solicitation is not authorized or to any person to whom it would be unlawful to make such offer or solicitation. Any reference in this document to specific securities and issuers are for illustrative purposes only, and should not be interpreted as recommendations to purchase or sell those securities. References in this document to investment funds that have not been registered with the FINMA cannot be distributed in or from Switzerland except to certain categories of eligible investors. Some of the entities of the NS Partners Group or its clients may hold a position in the financial instruments of any issuer discussed herein, or act as advisor to any such issuer.
Additional information is available on request.
© NS Partners Group
Quarterly Investment Review – Q3 2021
Quarterly Investment Review – Q3 2021
“Interest rates are to the value of assets what gravity is to matter.”
Warren Buffett, 1 May 2021
Markets moved sideways during the last quarter, against a poor background of international news. The chaotic exit of Allied troops from Afghanistan, the continued crackdown on some sectors of their economy by the Chinese Communist Party and a brewing energy crisis, all made for a poor backdrop. The stubborn persistence of Covid due to the Delta variant also delayed the reopening of economies. Covid’s impact is underlined by the fact that more Americans have died from it than were killed in action in World War II, Korean and Vietnam wars combined. In contrast markets have been bolstered by strong corporate earnings, and government and central bank policy has continued to be extremely supportive.
As we head into the fourth quarter market performance is likely to be determined by the pace of the recovery from the Covid pandemic and progress with vaccine development and its rollout, and by the extent to which inflation remains under control. If inflation does rise then the pressure to raise interest rates will increase and as the Buffett quote at the top of the page indicates that would exert downward pressure on many asset prices. So will the inflation tiger pounce?
Much of the current debate on inflation focuses on the extent to which it is transitory or something more permanent. Clearly some of it is transitory and the result of the supply chain disruption caused by the various lockdowns. These bottleneck issues will resolve. However some inflation looks more structural.
Click here to download the full document.
Past performance is not indicative of future results. The views, strategies and financial instruments described in this document may not be suitable for all investors. Opinions expressed are current opinions as of date(s) appearing in this material only.
References to market or composite indices, benchmarks or other measures of relative market performance over a specified period of time are provided for your information only. NS Partners provides no warranty and makes no representation of any kind whatsoever regarding the accuracy and completeness of any data, including financial market data, quotes, research notes or other financial instrument referred to in this document.
This document does not constitute an offer or solicitation to any person in any jurisdiction in which such offer or solicitation is not authorized or to any person to whom it would be unlawful to make such offer or solicitation. Any reference in this document to specific securities and issuers are for illustrative purposes only, and should not be interpreted as recommendations to purchase or sell those securities. References in this document to investment funds that have not been registered with the FINMA cannot be distributed in or from Switzerland except to certain categories of eligible investors. Some of the entities of the NS Partners Group or its clients may hold a position in the financial instruments of any issuer discussed herein, or act as advisor to any such issuer.
Additional information is available on request. © NS Partners Group
Chart of the Month – From carbon to silicon. The case to invest in semiconductors.
From carbon to silicon. The case to invest in semiconductors.
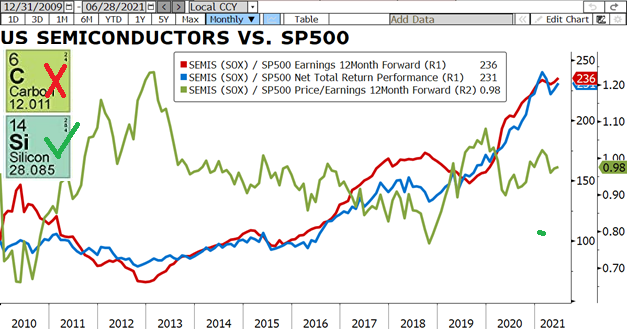
With the climate change, there is a huge trend to decrease the use of fossil fuels, whose main component is carbon. By chance, in the famous periodic table, silicon is just below carbon, and silicon is the main component of the semiconductor chips, which are the foundations of the digital economy. These small chips are the essential technology that makes anything computerised or digital work.
The chart above (blue line) shows the relative performance of the Philadelphia Semiconductor Index (SOX) compared to the performance of the SP500. During the last 11.5 years, this index has outperformed the SP500 by 7.8% per year!!!
What a coincidence that the profits (red line) of semiconductors have also been 7.8% higher per year!!! Once in a while the market seems to be efficient.
Where did the growth come from?
- Communications (33% of demand), which had a phenomenal growth
- Computers (29%). Growth has decreased but it is a main component of all computers.
- Consumer (13%). Consumer electronic products rely on semiconductors
- Automotive (12%). Cars are increasingly using semiconductors for many functions
- Industrial (12%). Microcontrollers, power devices, sensors, etc, all need semiconductors
The important question is: Where will the future demand come from?
- OLD: Communications, computers, consumers, industrials will continue to use more and more chips as the economy continues to “digitalise”.
- NEW: Electric and Hybrid vehicles need between 3.0 and 3.3 times more chips than a traditional vehicle, and the new economy is going to migrate at an accelerated rate to electric vehicles.
- NEW: 5G will enable the wide use of the Internet of Things and self-driven cars, which are going to be reliant on chips.
- NEW: Artificial Intelligence, gaming devices, quantum computers, will all use powerful microprocessors to fulfill their requirements.
With all this use of chips, the demand of semiconductors has outstripped supply to a level such that auto makers cannot deliver enough cars due to chip shortages. Video cards are not fully available either nor video game consoles.
How much do we have to pay to get exposure to semiconductors? the green line in the chart shows the relative PE of semis at 0.98 versus the SP500, more or less in line with the average since 2009. Today, the investor pays the same earnings multiple for semis as he does for the SP500!!!
CONCLUSION
Interesting sector: it grows faster than the market; it is highly exposed to the “digital” economy; it will profit from the migration to electric vehicles; it will profit from the 5G deployment… and all of these without paying a premium!!
Past performance is not indicative of future results. The views, strategies and financial instruments described in this document may not be suitable for all investors. Opinions expressed are current opinions as of date(s) appearing in this material only.
References to market or composite indices, benchmarks or other measures of relative market performance over a specified period of time are provided for your information only. Notz, Stucki provides no warranty and makes no representation of any kind whatsoever regarding the accuracy and completeness of any data, including financial market data, quotes, research notes or other financial instrument referred to in this document.
This document does not constitute an offer or solicitation to any person in any jurisdiction in which such offer or solicitation is not authorized or to any person to whom it would be unlawful to make such offer or solicitation. Any reference in this document to specific securities and issuers are for illustrative purposes only, and should not be interpreted as recommendations to purchase or sell those securities. References in this document to investment funds that have not been registered with the FINMA cannot be distributed in or from Switzerland except to certain categories of eligible investors. Some of the entities of the Notz Stucki Group or its clients may hold a position in the financial instruments of any issuer discussed herein, or act as advisor to any such issuer.
Additional information is available on request.
© Notz Stucki Group
Quarterly Investment Review – Q2 2021
Quarterly Investment Review – Q2 2021
Markets continued to move ahead in the second quarter as vaccinations were rolled out, allowing lockdowns to be eased. The vaccination process is most advanced in the US, with Europe a couple of months behind, and the Emerging Markets only really starting their programs now. Nonetheless the stock market recovery of the last year seems incredible against a background where the EU suffered its worst recession since the 1930’s, the world has seen the first rise in poverty for twenty years, and millions of families have seen their prospects and financial situation dashed. The exuberant financial performance has come on the back of the huge double barrelled fiscal and monetary response by governments and central banks, which in turn has led to the question of when these support operations will stop, and whether they will trigger inflation.
The policy response to Covid was extraordinarily aggressive. The fiscal response in the first three months was equal to that of the previous five recessions in the US. US monetary policy produced more QE in six weeks than the total of the 2009-2018 period following the Financial Crisis of 2008. This has led to an abrupt recovery, but more puzzling is this unprecedented stimulus has continued even when the recovery is fully evident. The Fed still buys $40bn of mortgages a month even though there is now a housing shortage. They have said that they are not thinking of reducing their bond purchases of $120bn a month, and do not expect to raise interest rates till 2023 despite the booming economy. The strongest economic recovery since 1945 is being met with the easiest financial conditions on record. At 25% of GDP the recently announced programs of President Biden are greater than Lyndon Johnson’s Great Society programs of the 1960’s. It suggests that the authorities have some doubt as to how well economies would manage if these supports were removed. While the recovery allows the private economy to pick up, there is a big gap to fill. The setbacks and uncertainty caused by the variant strains of Covid also make full unwinding of the lockdowns more complicated. This makes the authorities’ task of judging how and when to withdraw their stimulus much harder.
Will this stimulus translate into higher inflation?
Click here to download the full document.
Past performance is not indicative of future results. The views, strategies and financial instruments described in this document may not be suitable for all investors. Opinions expressed are current opinions as of date(s) appearing in this material only.
References to market or composite indices, benchmarks or other measures of relative market performance over a specified period of time are provided for your information only. Notz, Stucki provides no warranty and makes no representation of any kind whatsoever regarding the accuracy and completeness of any data, including financial market data, quotes, research notes or other financial instrument referred to in this document.
This document does not constitute an offer or solicitation to any person in any jurisdiction in which such offer or solicitation is not authorized or to any person to whom it would be unlawful to make such offer or solicitation. Any reference in this document to specific securities and issuers are for illustrative purposes only, and should not be interpreted as recommendations to purchase or sell those securities. References in this document to investment funds that have not been registered with the FINMA cannot be distributed in or from Switzerland except to certain categories of eligible investors. Some of the entities of the Notz Stucki Group or its clients may hold a position in the financial instruments of any issuer discussed herein, or act as advisor to any such issuer.
Additional information is available on request. © Notz Stucki Group