Perception vs. Reality: Are (more business friendly) Republican Presidents better for the Equity Market?

Daniel Kahneman, the Nobel Prize in Economic Sciences in 2002, wrote a best-selling book entitled “Thinking, Fast and Slow”. The central thesis of the book is that human beings have two modes of thought: System 1: Fast, instinctive and emotional;  System 2: Slow, deliberative and logical. We can say that System 1 resembles  the PERCEPTION, whereas,  System 2 is closer to the REALITY. Being so fast and so emotional, sometimes the PERCEPTIONS may distort or exaggerate the news delivered by the market, whereas REALITY gives the investor a medium-long term framework to better assess the market situation.

Discover our monthly series “Perception vs. Reality”!
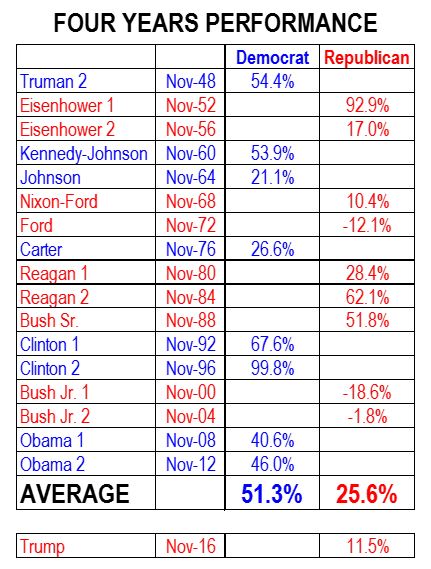
Source: Bloomberg. Performance: S&P500 Price Only.

PERCEPTION

Republican led administrations in the US are typically more business friendly than Democrat ones. Republicans are more likely to decrease taxes, to deregulate markets, to better control the budget deficit, to decrease the Government size and generally speaking to create a better environment for companies. Looking at history, Republican Presidents have had in their cabinet more business people to lead the country. As a dramatic example, Trump’s cabinet has about 50% of its members with a business background, the highest proportion since WWII, whereas Obama’s administration had only 10% on a comparable basis, which was the lowest proportion since WWII. With these hard data, investors can infer that US stock markets should have performed better while a Republican President was in office, and also will expect a good equity market during Trump’s government.

REALITY

The table shows the performances of the S&P500 (price only) since WWII, and… surprise, surprise! the S&P500 has performed much better when a Democrat was in the White House. The 4 year average mandate of a Democrat presidency has seen a 51.3% performance whereas a Republic presidency has delivered only 25.6%, just half of the performance of a Democrat administration. We are counting only 17 periods with 8 Democrats and 9 Republicans, but in any case, it sounds quite counterintuitive.“It is the economy stupid”, was the sentence used by Bill Clinton to explain why he beat Bush Sr. in the Nov-92 elections. We may also say that the economy, market valuation, luck and other factors may explain this reality. For instance:

  • Clinton took office after the 1991 US recession, so his first mandate took place during an economic recovery that was due after the recession, and so the market made 67.6% in 4 years.
  • The second Clinton administration enjoyed the technology bubble, so the market gained 99.8%
  • Bush Jr. was elected President when the S&P500 was quoted at 19.5 times 12M forward earnings, so his first mandate was overseeing the burst of the TMT bubble and the market fell 18.6%
  • Ford was unlucky to be President when the OPEC started to push oil prices up.
  • Obama was lucky to start his presidency when the SP500 had just collapsed and was quoted at 11.8 times 12M forward earnings.

Besides all these specific situations, it is very important to remember that the US is a very strong democracy with many checks and balances, with powerful House, Senate and Governors who have a big influence in politics and in the economy. Likewise, US corporates are very strong and well managed and have a profit cycle that might be independent of the political party of the President.

CONCLUSION

In the US (and in most developed economies), politics are much less influential on the performance of equity market than what people think, whereas the most typical financial and economic factors remain the best indicators for expected equity performance: FED hiking rates is not good news; lower corporate taxes will be good news; deregulation will be good news; a high PE ratio (17.9 today) is not good news, etc. The market will switch from a Trump led market to an economic led market.
Perception vs. Reality: US Election

Daniel Kahneman, the Nobel Prize in Economic Sciences in 2002, wrote a best-selling book entitled “Thinking, Fast and Slow”. The central thesis of the book is that human beings have two modes of thought: System 1: Fast, instinctive and emotional;  System 2: Slow, deliberative and logical. We can say that System 1 resembles  the PERCEPTION, whereas,  System 2 is closer to the REALITY. Being so fast and so emotional, sometimes the PERCEPTIONS may distort or exaggerate the news delivered by the market, whereas REALITY gives the investor a medium-long term framework to better assess the market situation.

Discover our monthly series “Perception vs. Reality”!

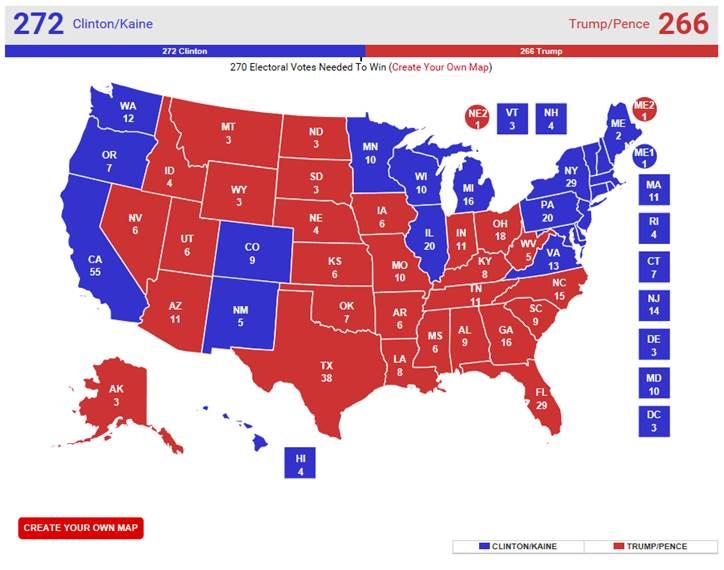
Source: RealClearPolitics

PERCEPTION

Americans prefered Trump to Clinton.
The polls were totally wrong.

REALITY

Although Trump was elected president because of the peculiarities of the US electoral system, Clinton had more votes than Trump.
Clinton: 47.7% Vs. Trump: 47.1%

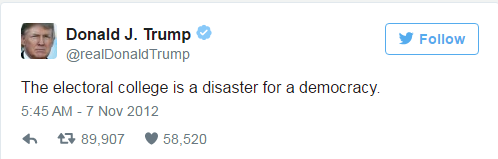
Source: Twitter
Source: Twitter

In fact what Trump called “the electoral college disaster” in 2012 was making him president, despite having had less votes.

Was the election outcome a surprise?
Only to certain extend. This chart was the best estimation the day before the election. Trump won PA (+20), WI (+10), MI (+16) and lost NV(-6), and he went from 266 to 306 electors. In PA, WI and MI the difference was only +1% and that made the difference.

CONCLUSION

The polls, were not that bad, but the media and investors were the ones who did not properly read that beforehand was already a very closed call.

Perception vs. Reality: Should we blindy buy high dividend yield stocks? NO. Should we buy increasing dividend yield stocks? YES.

Daniel Kahneman, the Nobel Prize in Economic Sciences in 2002, wrote a best-selling book entitled “Thinking, Fast and Slow”. The central thesis of the book is that human beings have two modes of thought: System 1: Fast, instinctive and emotional;  System 2: Slow, deliberative and logical. We can say that System 1 resembles  the PERCEPTION, whereas,  System 2 is closer to the REALITY. Being so fast and so emotional, sometimes the PERCEPTIONS may distort or exaggerate the news delivered by the market, whereas REALITY gives the investor a medium-long term framework to better assess the market situation.

Discover our monthly series “Perception vs. Reality”!

PvR Sep16
Source: Bloomberg

PERCEPTION

The common wisdom says that buying high dividend yield (HDY) stocks is an investment strategy that is more profitable and less risky than buying other stocks. Many investors like receiving dividend checks from companies that pay regularly regardless of the share price movement. Besides, HDY companies must be doing well in their business as they have the cash to pay the dividend. More than 50% of the historical returns of US equities comes from the dividends. Additionally, in a low yield return environment like today’s, more investors focus on HDY stocks to compensate for the lower levels of fixed-income coupons. Finally, in a relatively high valuation environment like the one we have in 2016, high dividend yield stocks seems to be less risky.

REALITY

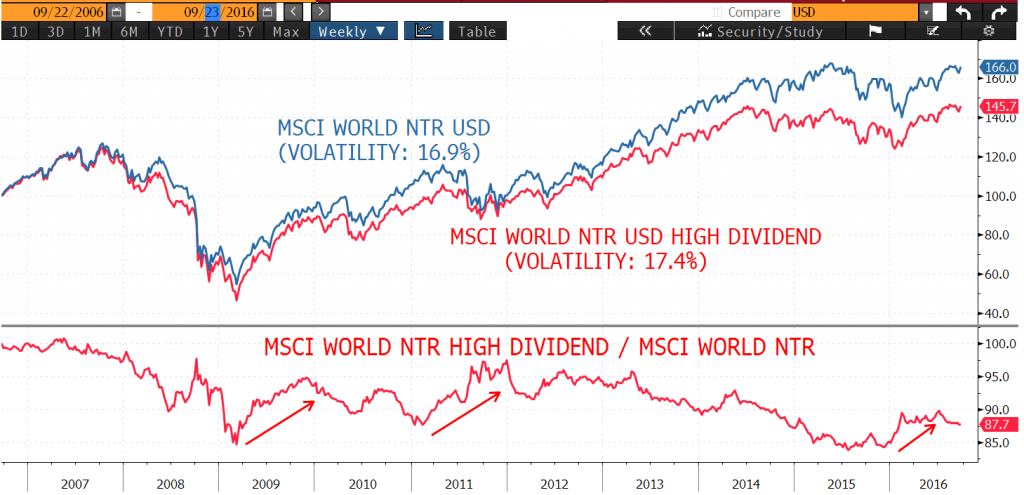
The graph above shows the performance of the MSCI World Net Total Return Index in USD vs. the performance of the MSCI World Net Total Return USD High Dividend stocks, and surprisingly the HDY strategy has underperformed by 12.3% accumulated during this 10 yr. period. To make matters worse, the volatility of the HDY strategy has been 17.4% vs 16.9% of the total index. Just the opposite of the initial expectations. Why such a counterintuitive evidence?

Let’s take the famous Gordon Growth Model to value a stock: Value = D / (k – g), where:
D: Next year’s expected annual dividend per share.
K: Discount rate of required rate of return.
G: Expected dividend growth rate (assumed constant)

When an investor blindly buys a HDY stock is missing the RISK of the stock (the K in the formula) and also missing the EXPECTED GROWTH rate (the g in the formula) of the dividend. For instance, many banks had had in the past high dividend yields that could not be maintained, hence the growth was negative and the shares fell dramatically during the 2008 crisis. Another typical case is the utilities and telecom companies that have high dividends but very low growth in their business, so they are not such good investments.

But, wait a second! We have all heard about successful ETFs linked to the S&P500 Dividend Aristocrat. This index has outperformed the S&P500 by 3.0% per year for the last 10 years. Isn’t this a contradiction? Apparently yes, but looking at the description of the index, they choose companies that “followed a policy of consistently increasing dividends every year for at least 25 consecutive years”. The key word is consistently increasing dividends or sustainable dividends.

One important remark in the graph is that despite the overall underperformance of a blind HDY strategy, there are periods where HDY stocks do relatively well as it has been the case during this year where investors flew to anything that looked like high yield asset: REITs, Fixed-Income HY, Emerging Market debt, Real Estate, and HDY stocks (see the bottom panel in the graph). Nevertheless, this outperformance has historically been short lived and this year also we have seen a relative peak performance by 30-June.

CONCLUSION

Investors should not follow blind simple strategies to invest like buying HDY stocks. Very often, these companies cannot maintain the dividend and eventually cut the dividend. For instance some HDY stocks today are Royal Dutch (7.2%), Ericsson (6.3%), Allianz (5.5%), Vodafone (5.2%), AT&T (5.1%), Rio Tinto (4.2%), Unicredito (5.9%), etc. Chances are that some of these companies will not maintain the dividend or if they do, the dividend will not grow for a while.

Just a little change in the strategy to INCREASING dividend stock companies might work much better like Nestlé, Medtronic, General Electric, etc. These companies have a lower dividend yield (2.9%, 2.0% and 3.0% respectively), but increasing over time.

Perception vs. Reality: Are Equity Emerging Markets linked to Commodities? No.

Daniel Kahneman, the Nobel Prize in Economic Sciences in 2002, wrote a best-selling book entitled “Thinking, Fast and Slow”. The central thesis of the book is that human beings have two modes of thought: System 1: Fast, instinctive and emotional;  System 2: Slow, deliberative and logical. We can say that System 1 resembles  the PERCEPTION, whereas,  System 2 is closer to the REALITY. Being so fast and so emotional, sometimes the PERCEPTIONS may distort or exaggerate the news delivered by the market, whereas REALITY gives the investor a medium-long term framework to better assess the market situation.

Discover our monthly series “Perception vs. Reality”!

Relative Performance Equity Emering Markets and Developed Markets Vs. GS Commodity Index Spot
Relative performance equity emerging markets / developed markets Vs. Goldman Sachs commodity index spot (31-jul-09 to 31-jul-16)

PERCEPTION

The common wisdom says that the relative performance of emerging markets is linked to the performance of commodities, so some investors may think that “betting” on emerging markets might be similar to “betting” on commodities. The thought process behind this is that some of the big oil exporters are based in emerging markets, like the Arabian Gulf countries, Russia, Venezuela, Nigeria, Libya, Mexico, etc. Also, some of the big exporters of industrial metals, grain, etc are Brazil, South Africa, Russia, Argentina, etc. Simultaneously, developed markets are the consumers of all of those commodities. The naïve conclusion can be: “if commodities prices go up, so will emerging market equities”.

REALITY

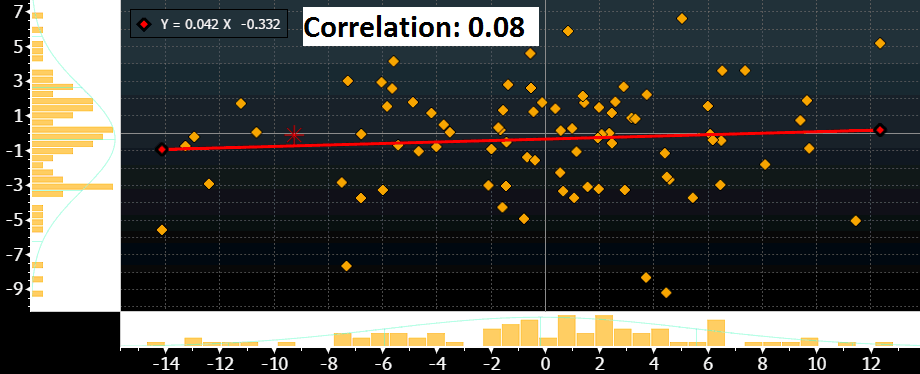
The graph above shows the correlation between the relative performance of MSCI Emerging Markets $ (vs MSCI Developed Markets $) vs. the GS Commodity Spot Index for the last 7 years. The correlation between them was 0.08, What a surprise! Or not!

A macro view to explain this zero correlation: The table 1 below shows the top 8 countries in the emerging markets world, and the four most important (China, India, Korea and Taiwan) all are importing commodities. What is even more meaningful is that India and China have been increasing their weights in the indexes and they benefit from lower commodity prices.

Table 1 – Source: Blackrock 18-Aug-16 
 Weight Index  Trade Balance
China  25.8 Importer
South Korea 14.7  Importer 
 Taiwan 11.9  Importer 
India  8.1  Importer 
Brazil   7.4 Exporter 
South Africa  7.1  Exporter 
Mexico  4.0  Exporter 
Russia  3.6  Exporter 

An equity sector view to explain this zero correlation: Table 2 shows the weight of the different sectors in both the MSCI Developed Markets and MSCI Emerging Markets. Coherent with the macro view, we can see that commodity related equities are 14.1% of Emerging Markets vs. 11.6% of Developed Markets. The small 2.5% weight difference is irrelevant. Besides, with Chinese equities increasing its weight in the indexes this small difference will soon be reduced to 0%. The large oil exporting countries (Saudi Arabia, Iraq, Iran, Venezuela, etc) contribute to small amount in the indexes.

Table 2 – Source: Blackrock 18-Aug-16
MSCI World Developed Markets MSCI Emerging Markets
Materials 4.9 6.8
Energy 6.7 7.3
Industrials 11.1 6.1
Consumer Discretionary 12.6 10.6
Consumer Staples 10.8 7.9
Health Care 13.2 2.3
Information Technology 14.7 23.2
Financials 19.2 26.6
Telecommunications 3.5 6.5
Utilities 3.3 2.7
TOTAL 100.00 100.00

CONCLUSION

The market is more rational than what investors think. If the large emerging markets are net importers of commodities, then the indexes should have a small exposure to commodity companies and so the correlation with commodities should be low, which happens to be the case.

Now that emerging market equities are becoming more attractive with large inflows, investors should take their decision to invest or not in emerging markets on other macro and micro data like GDP growth, inflation, monetary policy, regulation, etc.

Perception vs. Reality: Hedge Funds – Bad results, but neutral on a risk-adjusted basis.

Daniel Kahneman, the Nobel Prize in Economic Sciences in 2002, wrote a best-selling book entitled “Thinking, Fast and Slow”. The central thesis of the book is that human beings have two modes of thought: System 1: Fast, instinctive and emotional;  System 2: Slow, deliberative and logical. We can say that System 1 resembles  the PERCEPTION, whereas,  System 2 is closer to the REALITY. Being so fast and so emotional, sometimes the PERCEPTIONS may distort or exaggerate the news delivered by the market, whereas REALITY gives the investor a medium-long term framework to better assess the market situation.

Discover our monthly series “Perception vs. Reality”!

 Volatility CSHF and HFRI Index

PERCEPTION

absolute returns of the hedge funds
Warren Buffet

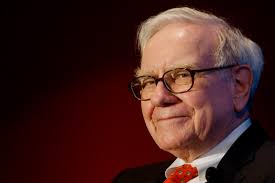
Warren Buffett, probably the best investor ever, made a bet in 2008 against Protégé Partners that its strategy that invests in hedge funds couldn’t beat a Vanguard mutual fund that tracks the S&P 500 Index. This weekend, during the annual gathering in Omaha, Buffett announced the returns after 8 years: The S&P500 index climbed 65.7% vs. 21.9% returned by the bundle of hedge funds selected by Protégé. The S&P500 index has been 3 times more profitable than investing in in hedge funds.

With headlines in all newspapers across the world, we can imagine that the perception is that hedge funds “get unbelievable fess for bad results” (Bloomberg). Besides, if Warren Buffett says this during his annual meeting, the perception gets into every investor’s mind.


REALITY

absolute returns of the hedge funds
William Sharpe

In 1990, Harry Markowitz and William Sharpe were awarded a Nobel Prize in Economic Sciences mainly because they were the pioneers in developing a theory about investments where returns and VOLATILITY must both be taking into account, and not only returns. This is quite a simple principle that we all were taught as the basic topic in Finance, but surprisingly, many times smart people forget it.

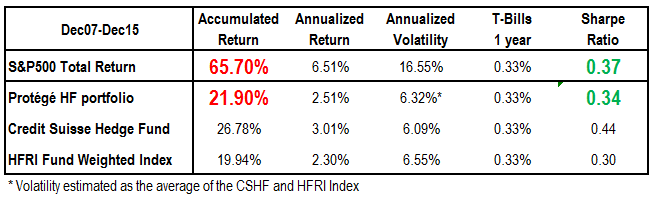
In the previous table, there is a comparison on a RISK-ADJUSTED RETURNS between the S&P500 and the Protégé HF portfolio. As we do not have information about the volatility of this portfolio, an estimation was made using the average volatility of the 2 best known hedge fund indexes.

[stop-align] The reality is quite different, as the Sharpe ratio of the hedge fund industry, the S&P500 and the Protégé HF portfolio are more or less in line, as can be seen in the table above.

It is important to consider also that hedge funds invest on a worldwide basis, and this comparison is made with the S&P500, which has been the best regional index in the world.


CONCLUSION

  1. Although the absolute returns of the HF industry have not been good, on a risk adjusted basis they have been in line with the performance of the S&P500 during the last 8 years. Better if we were to compare them with the MSCI World.
  2. Protégé forgot to make the bet not on absolute returns, but on a Sharpe ratio basis.
  3. This comparison does not take into account the liquidity risk: Whereas you can trade the S&P500 on a daily basis, hedge funds can be traded on a monthly or quarterly basis, so the performance of hedge funds should have been better to justify the lower liquidity.

Perception vs. Reality: are high yield ETFs riskier than similar funds?

Daniel Kahneman, the Nobel Prize in Economic Sciences in 2002, wrote a best-selling book entitled “Thinking, Fast and Slow”. The central thesis of the book is that human beings have two modes of thought: System 1: Fast, instinctive and emotional;  System 2: Slow, deliberative and logical. We can say that System 1 resembles  the PERCEPTION, whereas,  System 2 is closer to the REALITY. Being so fast and so emotional, sometimes the PERCEPTIONS may distort or exaggerate the news delivered by the market, whereas REALITY gives the investor a medium-long term framework to better assess the market situation.

Discover our monthly series “Perception vs. Reality”!

PERCEPTION

The Financial Times published on 10-Dec-15 the following headline and paragraph:

“US regulator highlights ETF and junk debt risks. A US regulator has rebuffed concerns over the health of the US corporate bond market, but highlighted “emerging risks” in exchange traded funds and junk debt”

Many investors, authorities, and other market players have been vocal over their concerns regarding new types of risks stemming from the high growth ETF market, specifically in High Yield (HY) ETFs: “They are passive investments which will invest in liquid and illiquid bonds”; “In a bear market, retail investors will get scared and sell their HY ETF creating liquidity mismatching problems”; “High Yield ETFs will not be able to honored redemptions in a bear market” are typical sentences taken from the financial press in the last 6 months.

Investors have legitimate reasons to be vigilant. These are not the most liquid securities and as we remember too well, during the Great Recession of 2008-09, equity shares dropped 50%, convertible bonds could not be sold and US high yield bonds lost 32% (peak to through), mainly because of the illiquidity of those assets. Fool me twice, shame on me as the saying goes and the argument that strong liquidity risks may originate from the mismatch between instant liquidity promised by HY ETFs and the low liquidity of their underlying assets, is a compelling one.

REALITY

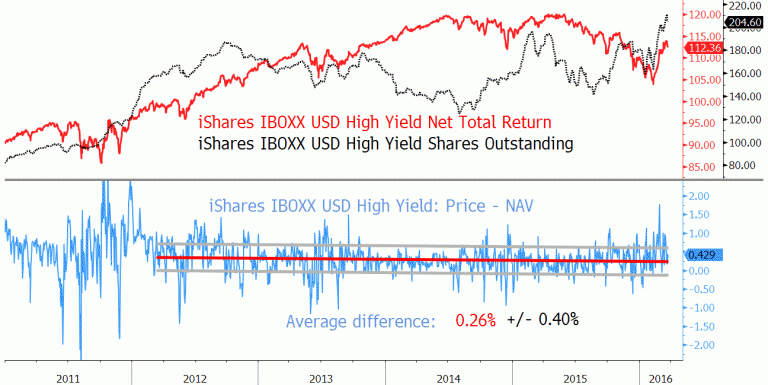
The red line in the top panel of the chart shows the performance (net of dividends) of the largest US HY ETF, iShares IBOXX USD HY which accounted for $15.5Bln as of 29 February‘16 out of the $48.2Bln of the total HY ETF market (1). The black line displays the total shares outstanding.

Source: Bloomberg & Notz Stucki

We can see how quickly investors reacted to bad news and, during the Jan-Feb bear market, redeemed about 11% of their investments in this ETF over 40 days (31 December ‘15 to 12 February‘16). These redemption volumes are more or less in line with what was happening during March-2015 to August-2015 or redemptions from June-2012 to June-2014. This is the first time after the summer of ’11 we’ve witnessed important selling in a falling HY market, the exact situation investors feared the most.

How did ETFs manage redemptions?

One way to measure it indirectly is by looking at the bottom panel that shows, in blue, the difference between the price of the ETF and the NAV. Whereas in the ‘11 bear market, the spread between price and NAV fluctuated often between +1% and -1%, the spreads in ‘12-‘16 have been tighter and moving in a band of -0.14% to 0.66% (-/+ one standard deviation), which we consider as perfectly acceptable. Interesting enough, after 12 February, investors turned around, and fearlessly started to buy shares. In fact today, the ETF has the highest level of assets in its history. With the benefit of several years’ experience, ETF managers have somehow learned how to better manage redemptions (the blue line tells the story).

Why could they handle redemptions “so well” contrary to expectations?

Let’s look at simple figures:

  • Total USD High Yield assets (domestic and international issuers): $1.8 tr. (JP Morgan)
  • Total USD High Yield assets managed by ETFs: $48.2 bn. (Blackrock)
  • Ratio ETFs / Total market: 2.6%

Even though investors may be faster to pull out money from ETFs, it does not seem to be much of an important risk for the market when they account for as little as 2.6% of the total assets.

CONCLUSION

HY ETFs have liquidity mismatches, but these are very similar to the investment funds invested in HY which offer daily liquidity. ETF managers have improved the techniques to handle redemptions vs. what happened in 2011. The relative size of HY ETFs vs industry is very small and needn’t be cause for much concern.

Be that as it may, this piece’s main purpose is to simply play down the risks associated with HY ETFs. When looking exclusively at performance, the largest active US mutual fund managers have done better than their passive counterparts as they avoided the bad components of the index…but this is a point best made another time.

(1) Doing the same analysis with the second largest HY ETF, SPDR Barclays High Yield, with $10.3 bn. assets draws similar conclusions.