Chart of the Month – CAPE–ability in question
CAPE–ability in question
« In theory there’s not much difference between practice and theory – but in practice, there is. » Yogi Berra.
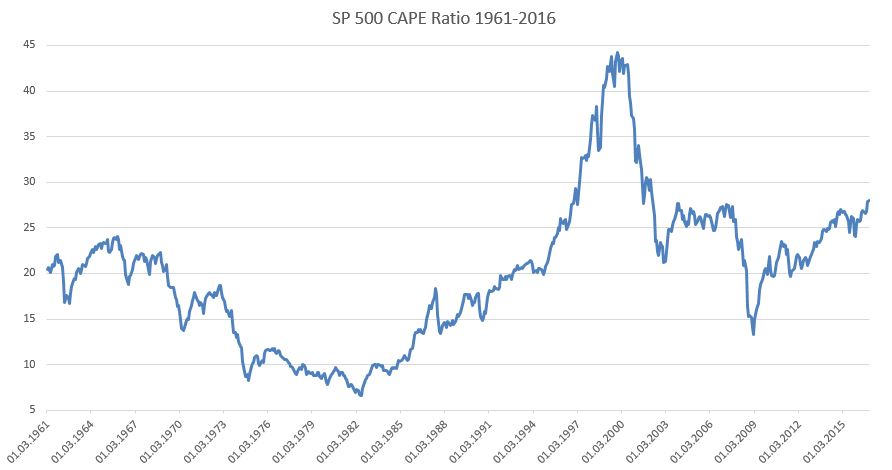
More and more warnings are being sent about the unsustainability of the current CAPE ratio for the SP500 and that a correction should occur, based on the very high level of the famous CAPE – the Cyclically Adjusted Price Earnings ratio.
This valuation measure of the equity market, brought by John Campbell and Robert Shiller in 1988, consists in taking a long term (typically 10 years) average of real earnings to calculate the Price Earnings ratio of a given equity index in order to smooth out short term profits’ volatility.
The economists did not set an absolute level of cheapness or expensiveness for their ratio, but the frequently mentioned levels are 20 (expensive) and 12 (cheap). Based on these numbers, investors should be wary of buying stocks when the CAPE stands above 20 (currently it is close to 28), and should on the contrary increase their exposure when the CAPE hovers below 12.
Our friend Jeffrey Saut, chief strategist at Raymond James Associates, has repeatedly questioned the accuracy of this measure during the last few years, so we’ve decided to crunch the numbers and simply look at some historical data to assess the relevance of the current warnings about the CAPE. The table here below recapitulates some periods with their associated CAPE and the monthly average of the subsequent 12 month price return on the SP500.
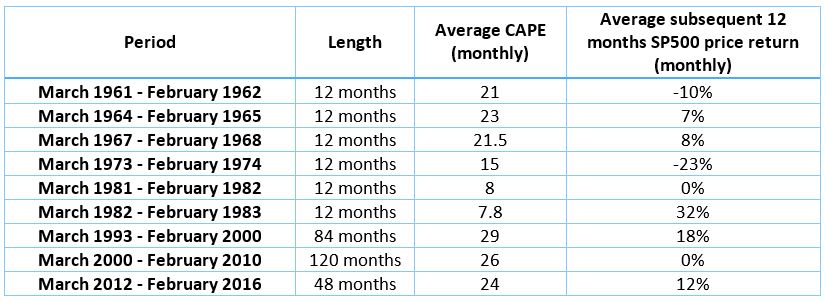
Based on these numbers, the conclusion is pretty straightforward: the predicting power of the CAPE for future returns is extremely poor if you set the 20 and 12 levels for dearness or attractiveness. Maybe the most striking example is between 1993-2000 when the average CAPE was 29, a record, but the average SP500 return of any given 12 month period during this time frame was a whopping 18%!
Even though CAPE is high today we think it has to be mitigated by a few factors:
- Interest rates ar still at historical lows, propping up valuations.
- Today’s CAPE includes the terrible 2008-2009 period when earnings were decimated, which should correct after 2019 CAPE calculations.
- The SP500 today is less cyclical than it used to be. There’s dominant group of sector like non -cyclical Information Technology, Healthcare, Consumer Staples which were not so highly represented in the past, when Industrials, Energy and Consumer Discretionary had much higher weightings.
- History seems to tell us that, as shown in the table, there’s no golden rule for assessing an alarming level for the CAPE.
The well-known CAPE theory would incite us to step away from US equities today, but we beg to differ.
Practice, as Yogi Berra said, does not necessarily go in sync with theory!