Chart of the Month – Credit investors: beware of the re-steepening

Credit investors: beware of the re-steepening


The slope of the US yield curve, which can be illustrated among other examples, by the difference between the US 10-year yield and the US 2-year yield has been widely used as an early indicator of recessions. Its normal slope should be positive, which means fixed income investors should be rewarded with a higher yield for buying bonds with longer maturities because, among other things, they sacrifice visibility on future inflation path and economic activity.

In the past, however, the yield curve has inverted various times between the 10-year and 2-year maturities. Some of those times include 1929, 1974 and 2008, where the inversion lasted particularly long and was followed by some well-known turbulences in the market.

The reason for these turbulences can be explained as follow: as the economy is slowing down, inflation is falling and unemployment starts rising, the market anticipates that the FED will have to cut rates to avoid a recession and to protect the labor market. Although the long-term part of the curve tends to move lower on the prospect of slower economic growth, the front end is much more reactive in reflecting the expected rate cuts from the FED. This mechanism creates what we call a bull steepening of the yield curve, where the 2-year yield drops faster than the 10-year yield.

The impact on credit spreads (a gauge of credit risk) is usually negative as we normally see a flight to safety during these periods of stress, where investors will favor quality over speculative assets, in other words, investment grade over high yield.

Over the last 30 years, as seen on the chart of this month, such occurrences also included the dot com bubble and the Covid pandemic. The shaded rectangles represent the period from the lowest point in the yield curve slope (in blue) and its highest point in the cycle. The dotted blue line is the frontier where the curve becomes inverted or positive again. We can see that credit spreads (in orange) have spiked in each of these periods to a cycle high.

Contrarily to a common misconception, it is not so much the yield curve inversion that coincides with spikes in credit spreads, but rather the re-steepening following these inversions. If we take the global financial crisis, for example, we can see that the yield curve started to invert in late 2005 already, without triggering any widening in credit spreads. It is only in the summer of 2007 (a few months after the curve hit the bottom and started rebounding) that the spreads spiked from a low of 240bps to a frightening high of 1’830bps.

As we can see in the chart, the yield curve has been inverted for more than 2 years in this cycle and has now re-steepened an impressive 124bps.

Today, credit spreads have remained muted and are below their historical average (the dotted orange line). It is of course not certain that history will repeat itself and that they will spike to new highs, but it is very unlikely that they will remain at such tight levels, especially given the uncertainty stemming from the approaching US elections and the two ongoing conflicts in Ukraine and in the Middle East.

Therefore, in such an environment, one should beware of the re-steepening of the yield curve and favor a higher quality in his or her credit portfolio.


Past performance is not indicative of future results. The views, strategies and financial instruments described in this document may not be suitable for all investors. Opinions expressed are current opinions as of date(s) appearing in this material only. References to market or composite indices, benchmarks or other measures of relative market performance over a specified period of time are provided for your information only. NS Partners provides no warranty and makes no representation of any kind whatsoever regarding the accuracy and completeness of any data, including financial market data, quotes, research notes or other financial instrument referred to in this document. This document does not constitute an offer or solicitation to any person in any jurisdiction in which such offer or solicitation is not authorized or to any person to whom it would be unlawful to make such offer or solicitation. Any reference in this document to specific securities and issuers are for illustrative purposes only, and should not be interpreted as recommendations to purchase or sell those securities. References in this document to investment funds that have not been registered with the FINMA cannot be distributed in or from Switzerland except to certain categories of eligible investors. Some of the entities of the NS Partners Group or its clients may hold a position in the financial instruments of any issuer discussed herein, or act as advisor to any such issuer.  Additional information is available on request.
© NS Partners Group

October General Market Comments

October General Market Comments

“Bitter Sweet Symphony” – The Verve, 1997.

Markets have been playing us this bitter sweet symphony this year, to paraphrase The Verve in their 1997 hit.

Sweet to a certain extent, as shown by the +6.4% return for the MSCI World year to date or the +9.2% for the S&P500 or, for the prescient or lucky ones having heavy exposure to the Nasdaq, a fantastic and very sweet +31.7%. These few numbers also highlight the massive polarization in equities this year; the famous Magnificent Seven explain almost the entire performance of these 3 indices, which leaves a bitter taste for many market participants who do not witness these flattering returns in their portfolios.

Bitter for long term USD bond holders, who have seen the value of their capital shrink despite expectations for a slowdown (if not a recession) in the economy that would normally favour this type of investments, not to mention their safe haven attributes in troubled geopolitical times like the ones we’re living through.

Bitter for those having placed bets on the famous China reopening, which has morphed into a money-losing trade (-7.7% for the CSI 300 year to date), and for those who logically expected Value to catch up versus Growth in a rising interest rates environment (the MSCI World Value is now down 3.6% year to date versus +17.2% for its Growth counterpart).

The MSCI World lost 3% in October, the S&P 500 2.2%, the Stoxx 600 3.7%, the Topix 3% and the MSCI Emerging Markets 3.9%. US 10 year yields rose by 36 bps, while German Bunds and Italian BTPs yields stayed more or less flat. The Israel-Palestine tinderbox had its effect on Gold (up 7.3%), but Oil markets ensnared market participants with an eye-popping 10.8% fall for the WTI, quite a flabbergasting move at a moment of severe tensions in the Middle East. Among other things, credit nudged down (-0,27% for the Itraxx Crossover), and the Japanese Yen further slumped versus the greenback (-1.4%) and is now down 15.6% year to date.

That’s it for this month’s Market Comments, stay tuned, markets never skip a beat.


Past performance is not indicative of future results. The views, strategies and financial instruments described in this document may not be suitable for all investors. Opinions expressed are current opinions as of date(s) appearing in this material only. References to market or composite indices, benchmarks or other measures of relative market performance over a specified period of time are provided for your information only. NS PARTNERS SA provides no warranty and makes no representation of any kind whatsoever regarding the accuracy and completeness of any data, including financial market data or other financial instruments referred to in this general comment. This document does not constitute an offer or solicitation to any person in any jurisdiction in which such offer or solicitation is not authorized or to any person to whom it would be unlawful to make such offer or solicitation. Any reference in this document to specific securities and issuers are for illustrative purposes only, and should not be interpreted as recommendations to purchase or sell those securities. References in this document to investment funds that have not been registered with the FINMA cannot be distributed in or from Switzerland except to certain categories of eligible investors. Some of the entities of the NS Partners Group or its clients may hold a position in the financial instruments of any issuer discussed herein, or act as advisor to any such issuer. Additional information is available on request. © NS Partners Group
August General Market Comments

August General Market Comments

“Hard to Handle”, Otis Redding, 1968, The Black Crowes, 1990.

Markets are good overall in 2023, but, to paraphrase Otis Redding in his 1968 song (and the Black Crowes in a very good reprise in 1990), they are definitely “hard to handle”. Why is it so? Well, first of all the economy, and especially in the US, has given us its dose of surprises: consensus pointed to a serious slowdown, possibly a recession, following the aggressive rates increases from Central Banks, but this has not materialized yet, and should probably not before at least Q2 2024. Then, the famous China reopening trade (remember, this was THE big thing in November 2022) has turned out to be a damp squib with the Chinese equity market and the renminbi lagging big time (the property market being one of the possible explanations). Then, the consensual view of a fading dollar in 2023 has proven wrong: not only does the broad dollar index (DXY) hold well, more or less flat this year, but two important currencies have slumped versus the greenback, namely the Japanese Yen and the Chinese renminbi (respectively down 10.97% and 5.22%). Finally, style wise, the overall increase in long term bond yields (+60 bps for the US 10 year, +18 bps for the German Bund) should have prevented Growth from performing well; thanks to the hype around Artificial Intelligence, Growth has humiliated Value so far this year (+27.38% for the MSCI World Growth versus a lacklustre +3.07% for its Value counterpart). Yes, hard to handle, indeed.

All equity indices were down in August 2023, barring the Japanese Topix (up 0.4%, but with a weak JPY, down 2.38% versus the dollar): -1.77% for the S&P500, -1.62% for the Nasdaq, -2.79% for the Stoxx 600 and a disastrous -6.36% for the MSCI Emerging Markets. On the fixed income side, Credit was flat, the US 10 year yield added 15bps, while the German 10 year Bund yield receded by 3 bps; this divergence might explain, at least partly, the weak euro (-1.53% versus the USD). Oil rose 2.24% for the WTI, while Gold abandoned 1.27%, here again a strong dollar providing a possible explanation.

That’s it for this month’s Market Comments, stay tuned, markets never skip a beat.


Past performance is not indicative of future results. The views, strategies and financial instruments described in this document may not be suitable for all investors. Opinions expressed are current opinions as of date(s) appearing in this material only. References to market or composite indices, benchmarks or other measures of relative market performance over a specified period of time are provided for your information only. NS PARTNERS SA provides no warranty and makes no representation of any kind whatsoever regarding the accuracy and completeness of any data, including financial market data or other financial instruments referred to in this general comment. This document does not constitute an offer or solicitation to any person in any jurisdiction in which such offer or solicitation is not authorized or to any person to whom it would be unlawful to make such offer or solicitation. Any reference in this document to specific securities and issuers are for illustrative purposes only, and should not be interpreted as recommendations to purchase or sell those securities. References in this document to investment funds that have not been registered with the FINMA cannot be distributed in or from Switzerland except to certain categories of eligible investors. Some of the entities of the NS Partners Group or its clients may hold a position in the financial instruments of any issuer discussed herein, or act as advisor to any such issuer. Additional information is available on request. © NS Partners Group

May General Market Comments

May General Market Comments

“Steamy Windows”, 1989 – A tribute to the legendary and immortal Tina Turner.

Trying to decipher the messages sent by economies and markets feels like trying to guess what lies behind steamy windows; you have an idea, but it’s not precise. Not more than 1 year ago, consensus was that a recession was inevitable in Europe and highly likely in the US, whereas it’s far less certain today; meanwhile, if not done yet, the Fed seems close to end its hiking cycle. China reopening should have triggered a massive boom for its equity market and commodities, but it hasn’t. Debt ceiling fuzz saw the dollar rise while the last minute deal, avoiding a default, has been followed by dollar weakness. Beyond an unclear short term horizon, two gigantic long term investment cycles still prevail: Digitalization and Cleaner Energy.
The crazy hype around AI and Nvidia shouldn’t make us lose sight of the fact that there will be profound consequences in terms of productivity with the widespread use of AI.
May 2023 was one of these very complicated months for equity investors who, if they were not exposed to the happy few rising stocks, had good reasons to be frustrated; the S&P 500 was almost flat, but it would have significantly been down without the contribution from mega-IT components who, besides the S&P, propelled the Nasdaq 100 7.6% higher. The absence of IT behemoths has cruelly been felt by Europe and Emerging Markets (down 3.2% and 1.9%), while Japan rose (+3.6%) with a weak JPY. Growth unsurprisingly humiliated Value (+2.3% vs -5.0%), while the strength of the dollar weighed on the MSCI World, which ended up the month down 1.3%.
Fixed-income was mixed: US 10 year yield rose 22 bps, Germany was stable and Italy, a good gauge of risk aversion, saw its 10 year benchmark yield fall by 9 bps. Credit enjoyed another very good month (+0.7% for the Itraxx Crossover), while all commodities plummeted: Oil down 11.3%, Gold down 1.4% and the broad CRB Index down 5,3%.

That’s it for this month’s Market Comments, stay tuned, markets never skip a beat.


Past performance is not indicative of future results. The views, strategies and financial instruments described in this document may not be suitable for all investors. Opinions expressed are current opinions as of date(s) appearing in this material only. References to market or composite indices, benchmarks or other measures of relative market performance over a specified period of time are provided for your information only. NS PARTNERS SA provides no warranty and makes no representation of any kind whatsoever regarding the accuracy and completeness of any data, including financial market data or other financial instruments referred to in this general comment. This document does not constitute an offer or solicitation to any person in any jurisdiction in which such offer or solicitation is not authorized or to any person to whom it would be unlawful to make such offer or solicitation. Any reference in this document to specific securities and issuers are for illustrative purposes only, and should not be interpreted as recommendations to purchase or sell those securities. References in this document to investment funds that have not been registered with the FINMA cannot be distributed in or from Switzerland except to certain categories of eligible investors. Some of the entities of the NS Partners Group or its clients may hold a position in the financial instruments of any issuer discussed herein, or act as advisor to any such issuer. Additional information is available on request. © NS Partners Group

February General Market Comments

February General Market Comments

“This world today is a mess” – Donna Hightower, 1972.

A slowdown (or a recession?) is expected, but economic releases do not support this projection yet; hard landing, soft landing or no landing (?); China is reopening, but underperforms; Oil is supposed to get scarcer, but do not rise; a weakening dollar is in everybody’s mind, but the greenback doesn’t seem to agree; long term yields rise, but Growth outperforms; Turkey is a NATO member and sends drones to help Ukraine, but also buys Oil and Gas from Russia; Chinese balloons fly over the US and its fighter jets circle around Taiwan; Mammoth Mountain in California has a 5 meters snow base, while Zermatt in Switzerland has 10 centimeters; and the list goes on. Yes, this world today is a real crazy mess.

Markets have a hard time performing well when too much uncertainties hover around; they wander even more when contradicting signals show up, which is clearly the case. The outcome of the conflict between Russia and Ukraine is anybody’s guess, but this might not be what drives market sentiment (although a severe escalation would undoubtedly trigger a massive sell-off); it is still Central Banks, monetary policies and interest rates which heavily weigh on the direction of markets, and in parallel the economic outlook.

Here again, making predictions often equals to betting on the black or the red at the roulette…

Even though markets struggled in February, they did resist somewhat, as only a fraction of the gains recorded in January were erased: the MSCI World abandoned 2.53% but is still up 4.3% year to date as an example; the S&P 500 lost 2.6%, the Nasdaq 0.5%, but the dollar was strong (+2.72% for the DXY), which can provide an explanation for the positive returns from the MSCI Europe and the Topix (+1.6% and +0.9%) and the MSCI Emerging Markets’ weakness (-6.5%). In the context of rising interest rates (+41 bps and +37 bps for the US and the German 10 year yields respectively) and falling Commodity prices (-2.3% for the WTI and -3% for the CRB Index), Gold logically fell (-5.3%). Credit enjoyed a second positive month in a row: the Itraxx Crossover advanced 0.5% last month and is now up 3.5% year to date.


Past performance is not indicative of future results. The views, strategies and financial instruments described in this document may not be suitable for all investors. Opinions expressed are current opinions as of date(s) appearing in this material only. References to market or composite indices, benchmarks or other measures of relative market performance over a specified period of time are provided for your information only. NS PARTNERS SA provides no warranty and makes no representation of any kind whatsoever regarding the accuracy and completeness of any data, including financial market data or other financial instruments referred to in this general comment. This document does not constitute an offer or solicitation to any person in any jurisdiction in which such offer or solicitation is not authorized or to any person to whom it would be unlawful to make such offer or solicitation. Any reference in this document to specific securities and issuers are for illustrative purposes only, and should not be interpreted as recommendations to purchase or sell those securities. References in this document to investment funds that have not been registered with the FINMA cannot be distributed in or from Switzerland except to certain categories of eligible investors. Some of the entities of the NS Partners Group or its clients may hold a position in the financial instruments of any issuer discussed herein, or act as advisor to any such issuer. Additional information is available on request. © NS Partners Group

August General Market Comments

August General Market Comments

« You gimme fever, and a cold sweat » – James Brown, 1970

Like in the 70s, markets are giving us cold sweats on a regular basis since the beginning of the year. And fever sometimes, when they rebound sharply. August was a perfect illustration: after a red-hot July (+7.9%), the MSCI World roared until mid-month, adding more than 3.7% at some point, but miserably tanked thereafter to close the month with a -4.3% return.

Forget about what’s happening on the ground in Ukraine: it’s all about politics, from Governments and Central Banks. The politics of Energy, with Russia clearly willing to clamp down gas supplies to Europe and the panic this triggers on Electricity prices; the politics of Trade, with the US putting more and more limits for US corporations to deal with China when it comes to sensitive stuff (semiconductors for example); the politics of Climate, with countries all around the world thriving to reduce their carbon emissions; and, perhaps more importantly, the politics of Central Banks, with the Fed deliberately freaking out investors by announcing pain down the road, as its monetary policy will be tougher for longer.

A relatively pleasant earnings season has vanished very quickly in people’s minds, the focus being now on the consequences of Jerome Powell’s stubbornness. Soft landing? Soft recession? Deep recession? The worst situation for markets in general is when there are big uncertainties; among these, the first and foremost is the magnitude of the hiking cycle by the Fed: when will they stop, and at what level?

All this is too much for markets to stand still. The second half of August was painful, to say the least, and all major assets were down at the end of the month: as mentioned, the MSCI World lost 4.3%, more or less like the S&P 500 (-4.2%), the MSCI Europe was down 5.2%, World Value 3.3%, World Growth 5.4%. The Japanese Topix rose 1.2%, but the Yen tumbled a further 4.1% versus the USD, and is down a whopping 20.5% this year!

No respite on Government bonds, as the US 10 year rose 54 bps and the 10 year Bund 72 bps, while credit weakened again: the Itraxx Crossover fell 2.6%. Gold lost 3.1%, Oil suffered its worst drawdown this year with the WTI down 9.2%.

That’s it for this month’s Market Comments, stay tuned, markets never skip a beat.


Past performance is not indicative of future results. The views, strategies and financial instruments described in this document may not be suitable for all investors. Opinions expressed are current opinions as of date(s) appearing in this material only. References to market or composite indices, benchmarks or other measures of relative market performance over a specified period of time are provided for your information only. NS PARTNERS SA provides no warranty and makes no representation of any kind whatsoever regarding the accuracy and completeness of any data, including financial market data or other financial instruments referred to in this general comment. This document does not constitute an offer or solicitation to any person in any jurisdiction in which such offer or solicitation is not authorized or to any person to whom it would be unlawful to make such offer or solicitation. Any reference in this document to specific securities and issuers are for illustrative purposes only, and should not be interpreted as recommendations to purchase or sell those securities. References in this document to investment funds that have not been registered with the FINMA cannot be distributed in or from Switzerland except to certain categories of eligible investors. Some of the entities of the NS Partners Group or its clients may hold a position in the financial instruments of any issuer discussed herein, or act as advisor to any such issuer. Additional information is available on request. © NS Partners Group

June General Market Comments

June General Market Comments

« I want to know » – Adriano Celentano

I want to know… we all want to know: are we headed into a recession, or a slowdown? Have valuations sufficiently shrunk for this type of economic environment, or should we expect more pain ahead? Are fixed-income markets right when they bet on inflation coming back to 2.5% five years from now, or is core inflation higher and stickier? Are Central Banks still behind the curve, or ahead  now that economic activity seems more fragile? Will Russia and Ukraine agree one some kind of ceasefire soon, or will this conflict last for years as many military experts warn?

So many questions and so little clear answers indeed. We would like to know, but we don’t.

Uncertainty is the biggest handicap for financial markets to perform correctly and/or to behave smoothly; this is the reason why markets are so challenging and frustrating this year. The only strong message we receive from equity markets is that a severe slowdown, or a recession, is underway: only defensive sectors resist to the meltdown, and recently we have seen Energy and Materials, two good sectors so far this year, crack as well. Fixed-income markets indicate a mixed outlook: Government bonds yields are still quite high (read: low probability of a recession), but  Credit suffers, as witnessed by the Itraxx Crossover which lost 5.2% in June, and this is a signal of economic trouble ahead. Commodity markets are difficult to interpret: if a recession was due, they should crater, but they don’t, due to obvious supply constraints.

The MSCI World sank 8.8% in June, the S&P 500 8.4%, the MSCI Europe 7.9% the MSCI Emerging Markets 7.2%, and if Japan seemed to resist with a 2.2% drawdown for the Topix, this has to be mitigated by the dismal performance of the Yen (down 5.5% versus the dollar in June, 17.9% year to date!).

Oil fell 7.8%, more or less like Equity markets, Gold abandoned 1.6%, and Government bonds yields rose again: +17 bps for the US, +21 bps for Germany and +14 bps for Italy.

That’s it for this month’s Market Comments, stay tuned, markets never skip a beat.


Past performance is not indicative of future results. The views, strategies and financial instruments described in this document may not be suitable for all investors. Opinions expressed are current opinions as of date(s) appearing in this material only. References to market or composite indices, benchmarks or other measures of relative market performance over a specified period of time are provided for your information only. NS PARTNERS SA provides no warranty and makes no representation of any kind whatsoever regarding the accuracy and completeness of any data, including financial market data or other financial instruments referred to in this general comment. This document does not constitute an offer or solicitation to any person in any jurisdiction in which such offer or solicitation is not authorized or to any person to whom it would be unlawful to make such offer or solicitation. Any reference in this document to specific securities and issuers are for illustrative purposes only, and should not be interpreted as recommendations to purchase or sell those securities. References in this document to investment funds that have not been registered with the FINMA cannot be distributed in or from Switzerland except to certain categories of eligible investors. Some of the entities of the NS Partners Group or its clients may hold a position in the financial instruments of any issuer discussed herein, or act as advisor to any such issuer. Additional information is available on request. © NS Partners Group

Chart of the Month – During economic slowdown, increase defensive sectors

During economic slowdown, increase defensive sectors

Source: NS Partners, Bloomberg

The last few months have been very special. And recent economic and geopolitical developments have left investors scrambling for answers in the equity market. Where to invest? where to hide? And in which sectors? Should I invest in value stocks rather than growth companies? In defensive rather than cyclical sectors?

There has been a wide disparity on sectors valuation recently, with Price Earnings ratios surging since March 2020. In 2022, overvalued stocks were the most impacted regardless of their sector. There was no magic protection formula. Only small places to hide. So, beyond the proper diversification that we all try to achieve, what can we do?

One simple answer is: during economic downturns or recessions, one should periodically add defensive stocks to one’s portfolio.

Looking back over the last 5 years, there are two prominent examples. Firstly, in 2018, growing evidence of a general slowdown pushed investors to the safety side, especially at the end of a very difficult year in terms of relative performance. Then again, in 2020, when the pandemic-related shutdowns stated to impact the economic growth. What did we observe during these two periods? A marked outperformance of defensive sectors, with for instance, an outperformance of pharmaceutical companies relative to the market, as well as an outperformance of consumer staples relative to consumer discretionary, which is cyclical by nature. We used to say that consumer staples stocks are expensive. But lately, once again, the sector demonstrates its low volatility behavior. Unlike other sectors where valuations have boomed and then fallen in the last two years, the sector has maintained a PE next 12 months close to 20x (20.0x for 26.04.2017 and 20.6x at the end of April 2022).

Today, there are obviously other elements that have entered the decision matrix, including the rise in interest rates, Covid which is still present and the Russian invasion of Ukraine, which brings significant geopolitical risk and implications on commodity prices, supply chain issues, … In the US, real gross domestic product (GDP) growth stood at 5.5% in the fourth quarter of 2021 and is expected to sharply decrease to 2.1% in 2023. The same trend can also be seen for Europe.

Then the conclusion is clear: as the world economy will slow down, if one wants to stay invested in equities, one should go to non-cyclical companies, periodically overweighting defensive sectors (especially consumer staples sector and pharmaceutical companies), and diversify exposure at countries level. One example might be Swiss market. The large Swiss exposure to staples and pharma through Nestlé, Roche and Novartis is well known. More than half of the Swiss market is composed by defensive stocks (far more than in the World Index).


Past performance is not indicative of future results. The views, strategies and financial instruments described in this document may not be suitable for all investors. Opinions expressed are current opinions as of date(s) appearing in this material only. References to market or composite indices, benchmarks or other measures of relative market performance over a specified period of time are provided for your information only. NS Partners provides no warranty and makes no representation of any kind whatsoever regarding the accuracy and completeness of any data, including financial market data, quotes, research notes or other financial instrument referred to in this document. This document does not constitute an offer or solicitation to any person in any jurisdiction in which such offer or solicitation is not authorized or to any person to whom it would be unlawful to make such offer or solicitation. Any reference in this document to specific securities and issuers are for illustrative purposes only, and should not be interpreted as recommendations to purchase or sell those securities. References in this document to investment funds that have not been registered with the FINMA cannot be distributed in or from Switzerland except to certain categories of eligible investors. Some of the entities of the NS Partners Group or its clients may hold a position in the financial instruments of any issuer discussed herein, or act as advisor to any such issuer.  Additional information is available on request.

© NS Partners Group

Chart of the Month – «If you ask me anything I don’t know, I’m not going to answer» Yogi Berra

Chart  of the month «If you ask me anything I don’t know, I’m not going to answer» Yogi Berra

Source: Stifel Nicolaus, Notz Stucki

And yes, here we go again with one of Yogi Berra’s insightful quote, which, this time, applies for the fate of the economy. It’s anybody’s guess today to give an indication of where the global economy is headed for the next 12 to 24 months, which should not come as a surprise considering the multiple unknowns ahead of us.

First come, first serve, the Covid crisis seems far from abating and its consequences, although now roughly measurable for its first wave, are as opaque as the horizon on a foggy day on Golden Gate Bridge when it comes to its second wave. The outcome of the US elections will have an influence on the US and the global economy (tax increases, domestic stimulus); how will the European economy get out of the current dire straits in which it is stuck; what happens next with the immense amounts of liquidity and debt generated since the start of the crisis; what are the next steps in the China-US economic war; and the list goes on.

Equity markets seem so far to give hope a chance as they’ve recovered sharply from the March lows, but we know things can revert very fast and, amidst this stock prices recovery, there has been an extreme differentiation between sectors, which means that the global picture isn’t that clear for investors.

There’s a very silent economist, who very seldom appears, and whose message is almost always accurate: that’s the US yield curve, and in particular the 3 month-10 year steepness.

Does the US yield curve know something we don’t, as it did many times in the past?

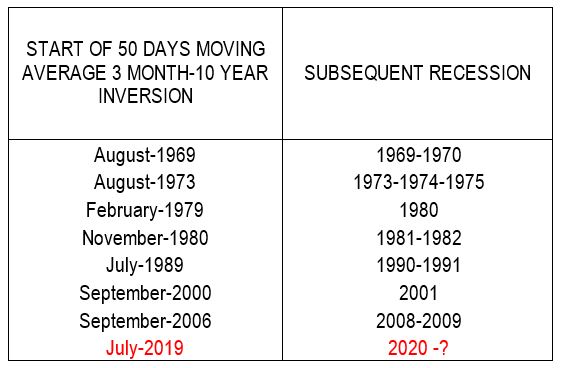
There have been 8 recessions in the US since 1969, including the current one. These 8 recessions had been announced in advance as shown on the table above by an inversion of the 50 days moving average of the US 3month-10 years yield differential (i.e. 3 month rates exceeding 10 years rates).

Very few paid attention to 2019’s inversion which happened in a buoyant mood for equity markets and, frankly, no cloud sufficiently big to make anybody contrarian enough to predict a recession in 2020. And this recession happened, for exogeneous factors (COVID-19) which, mid-2019, was totally unpredictable!

Now the good news, if we believe in the predictive power of the yield curve: it reverted into positive steepness in December 2019, and is now at its steepest point since then with a 57 basis points difference.

So if you’re questioned about something you don’t know, say the economy (nobody can predict the economy), you’re not going to answer; but the yield curve will. And today it’s a positive message.


Past performance is not indicative of future results. The views, strategies and financial instruments described in this document may not be suitable for all investors. Opinions expressed are current opinions as of date(s) appearing in this material only.

References to market or composite indices, benchmarks or other measures of relative market performance over a specified period of time are provided for your information only. Notz, Stucki provides no warranty and makes no representation of any kind whatsoever regarding the accuracy and completeness of any data, including financial market data, quotes, research notes or other financial instrument referred to in this document.

This document does not constitute an offer or solicitation to any person in any jurisdiction in which such offer or solicitation is not authorized or to any person to whom it would be unlawful to make such offer or solicitation. Any reference in this document to specific securities and issuers are for illustrative purposes only, and should not be interpreted as recommendations to purchase or sell those securities. References in this document to investment funds that have not been registered with the FINMA cannot be distributed in or from Switzerland except to certain categories of eligible investors. Some of the entities of the Notz Stucki Group or its clients may hold a position in the financial instruments of any issuer discussed herein, or act as advisor to any such issuer.

 Additional information is available on request.

© Notz Stucki Group