Chart of the Month – How to assess the risk of an equity portfolio today?

How to assess the risk of an equity portfolio today?
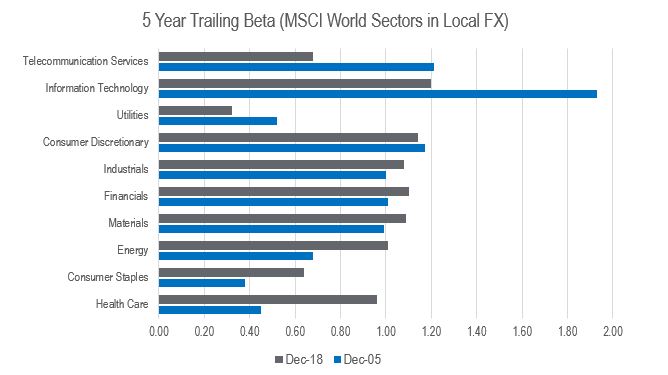
Source : Cantillon, FactSet

Calculating the beta has traditionally been a good way to assess the risk associated to a stock in a portfolio. The beta measures the sensitivity of the stock price to a market index. The higher the beta, the higher the amplitude of the stock price with the market on both long and short sides. In theory, having a portfolio of low beta stocks should protect you more in terms of downside during a market correction.

The issue is that, as shown in the table above, the 5 Year Trailing Beta for most sectors has significantly changed over the last 3 years. With technology disruption in action in almost all parts of the economy, some companies which belong to defensive sectors are now more vulnerable with less strong barriers to entry. Healthcare and Consumer Staples have seen the highest increase in terms of beta whereas Telecommunication Services appear as among the less risky sectors to invest in today!

The reality is that beta is only one statistic to look at and other parameters like factors and styles have more explanatory power to performance today. Momentum was the best performing factor by far until the last quarter of 2018 which saw a huge reversal. To make the story even more complex, the beta of factors are also less stable over time and record factor correlation explains the poor returns of quantitative and risk premia managers last year.

At Notz Stucki, we are well aware of factor exposures and correlations when managing our equity portfolios. But the first question we ask ourselves when we analyze a company is do we want to own this business and is it able to generate good long-term compounding returns over the years.
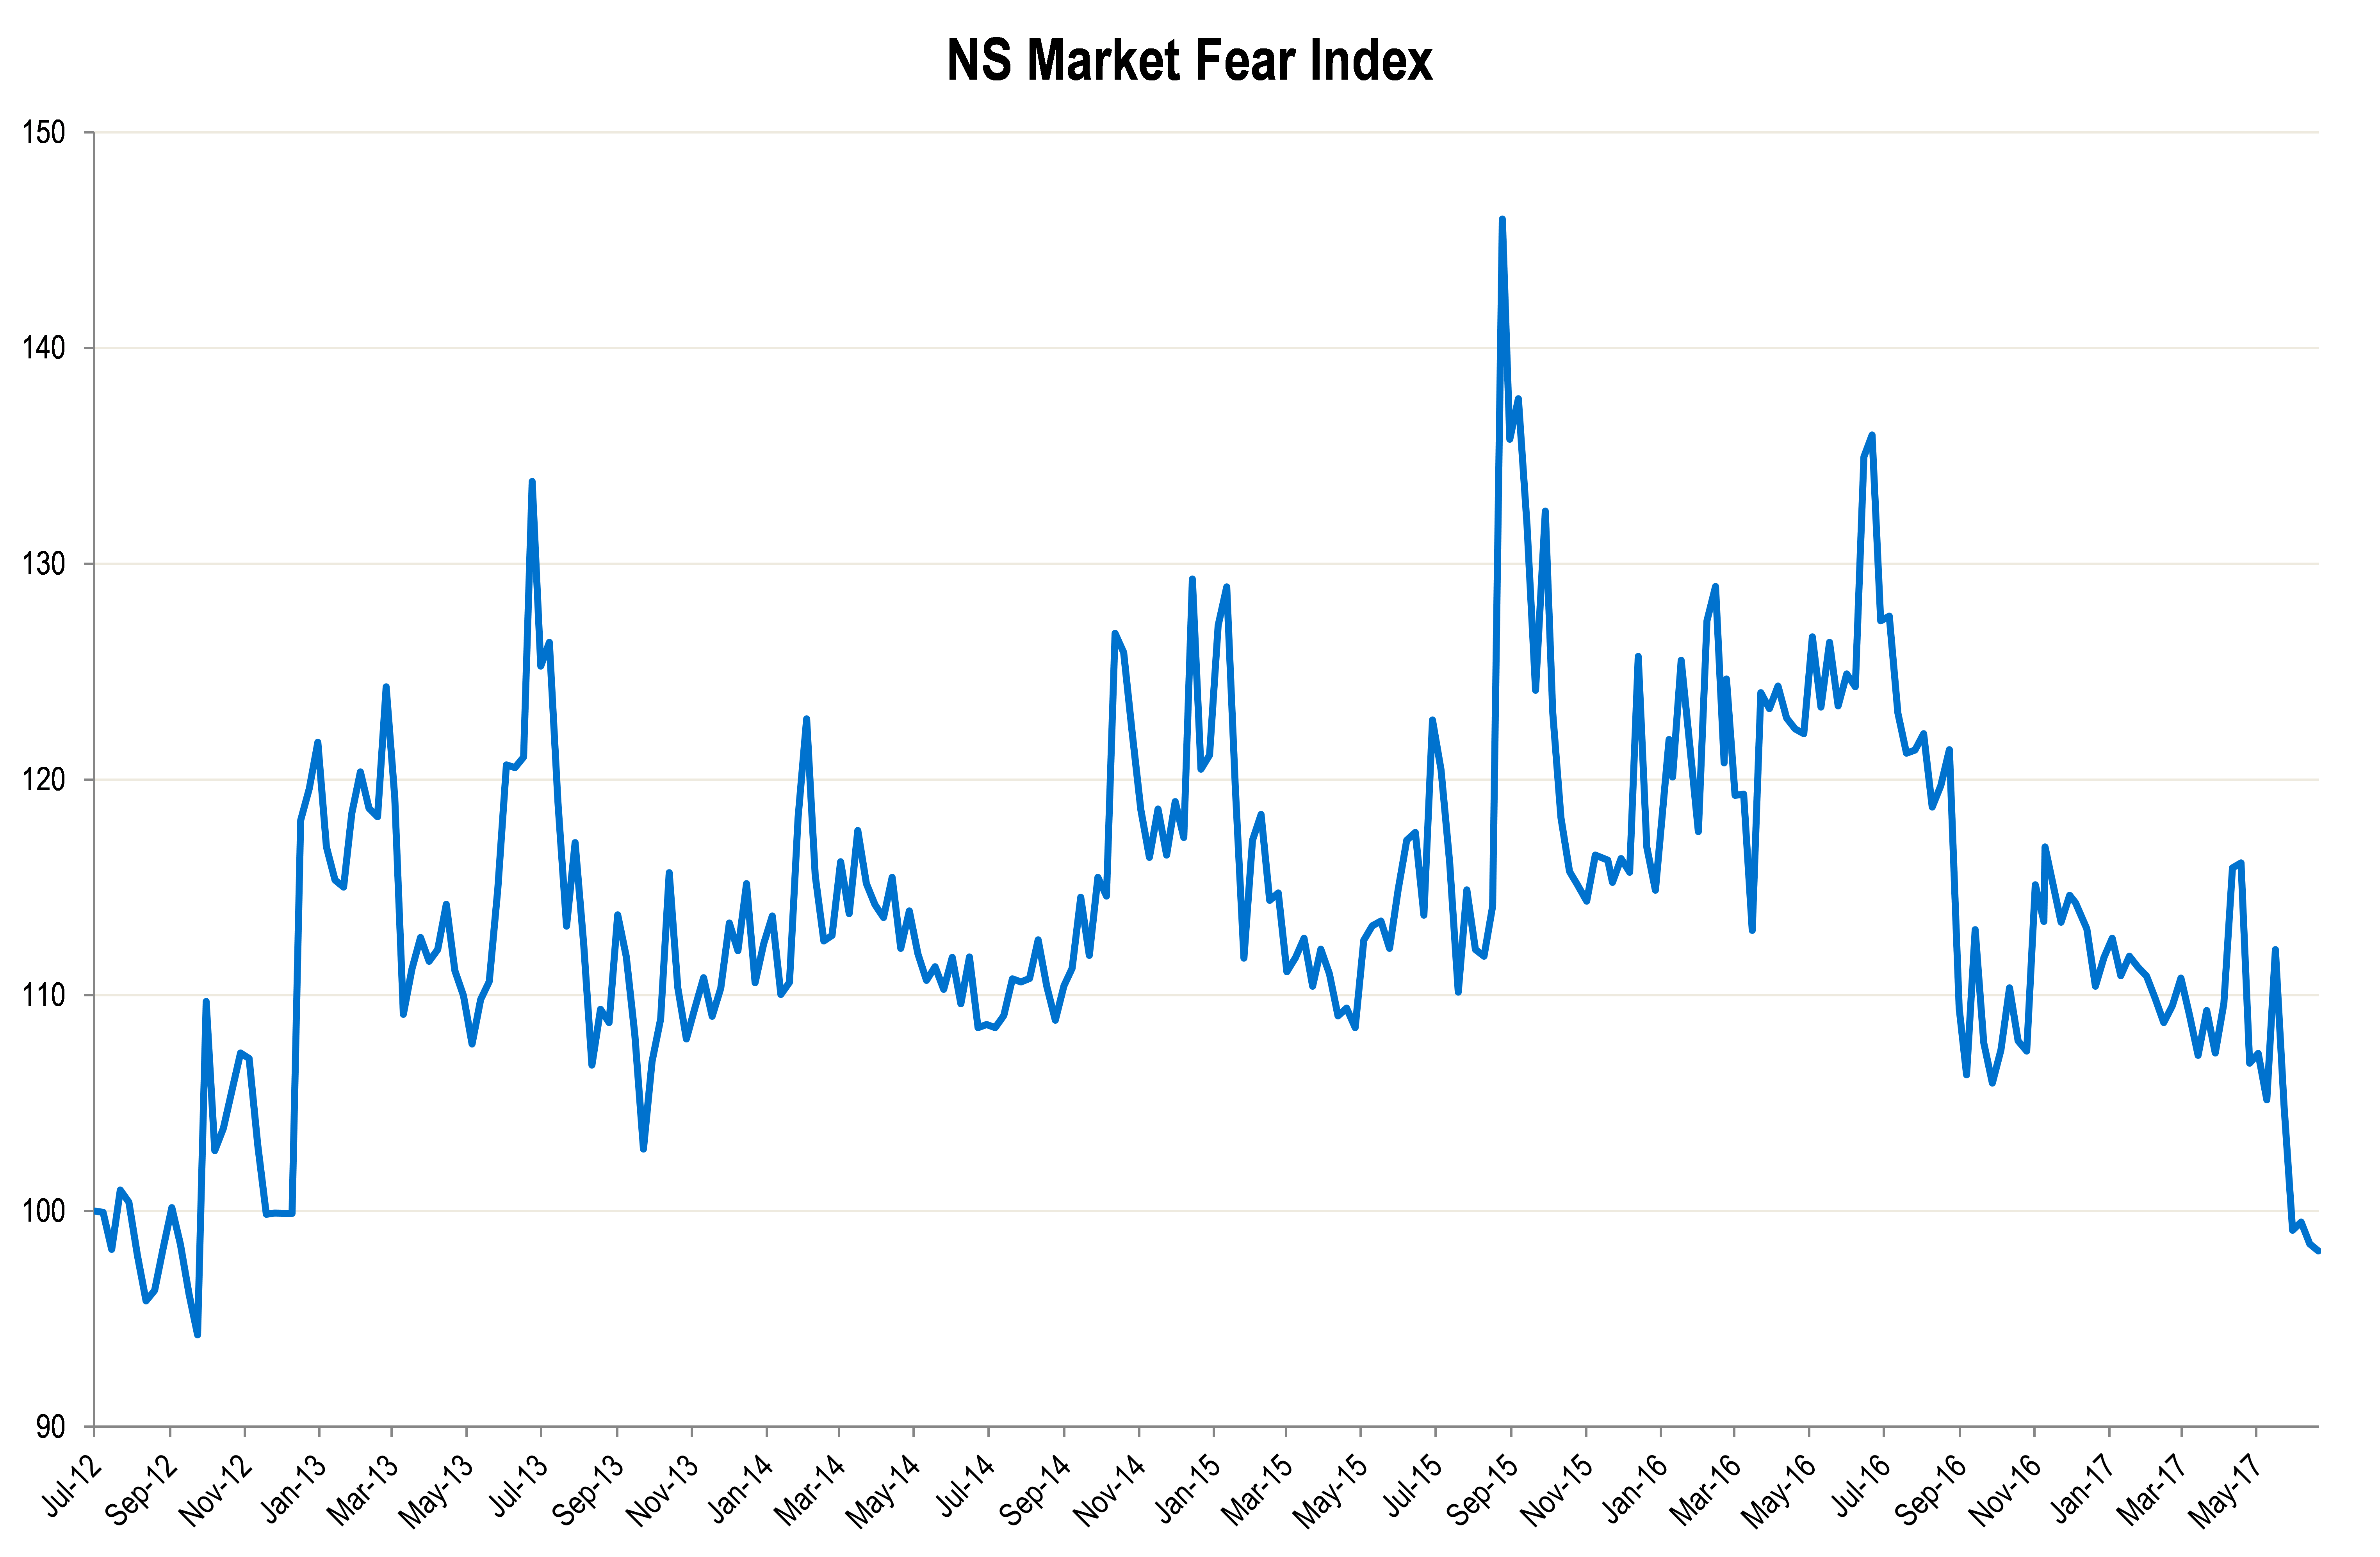
Chart of the Month – Swiss Equity Market: low volatility does not mean low risk!

Swiss Equity Market

Low volatility does not mean low risk!

Source: Notz Stucki

In an environment characterized but high political and policy risk, low levels of market volatility seem paradoxical. Volatility expectations for stocks and bonds have sunk to levels not seen since 1990. The VIX Index, which reflects a market estimate of future equity volatility, traded below the psychological level of 10 during 16 days this year (it only occurred 35 times since 1990) and the MOVE Index, which measures bond volatility, reached its all-time low recently.

There are different explanations for such a low volatility environment:

  1. On the macro side, low interest rates have encouraged investors to buy assets boosting their prices and in turn reducing volatility. With QE, central banks have put a floor under global asset prices with unprecedented balance sheet expansions. Finally solid economic growth with contained inflation means little reason for prices to move significantly.
  2. Market participants have changed their way of investing with large inflows into passive investment solutions like index-trackers and ETFs across all asset classes and the growing popularity of low volatility/diversified risk premia funds. Due to regulation, banks and insurers have invested massively into Government bonds to the detriment of “traditional risk” assets. Finally, algorithmic trading represents more and more of daily market volumes and machines are able to capture short term moves or inefficiencies, which mean smaller and fewer swings in prices before equilibrium is found.

But this doesn’t mean low risk! In asset allocation models, exposure to risky assets have increased over the last few weeks as low volatility is a mathematical driver of trade sizing codified in hundreds of billions of risk managed investment strategies. This false signal of safety could result is an inability for investors to appreciate how quickly market conditions  could change, which make trading strategies more vulnerable to unwinding and amplifying a risk-off event.

At the Notz Stucki Group, the Asset Allocation Committee decides of the asset allocation of managed portfolios. A balanced portfolio currently shows the following allocation: 50% equities, 25% fixed-income and 25% absolute return strategies with little cash.

The NS Market Fear Index (please see above) is a fusion of volatility indices on equities, fixed-income, currencies and commodities with a similar weighting in each asset class as we have in the balanced portfolio over time. The recent levels reached by the NS Market Fear Index are among the lowest for the last 5 years.

But we are aware of the situation and are acting accordingly. First, we adapt our asset allocation in function of the changing market environment and we don’t hesitate raising cash if needed. Secondly our main focus is active management and we are invested both internally and externally with flexible independent asset managers who try to preserve capital. Finally, we bought some puts in equity portfolios, have maintained a short duration in fixed-income products, decreased the exposure to managers with higher leverage and keep a 25% allocation to absolute return strategies which are less sensitive to periods of risk off and volatility spikes.