Chart of the Month – Small caps versus large caps: small is beautiful… Especially in Europe!
Small caps versus large caps: small is beautiful… Especially in Europe!
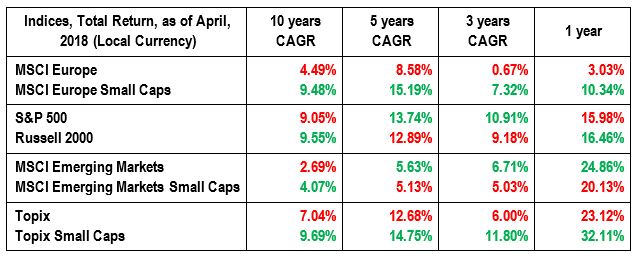
It is often said that Small Caps outperform Large Caps over the long term; it is true, and makes sense. Smaller companies are more agile, tend to fall less under the burden of regulation, and are generally more “pure plays” on their businesses. On top of that, small caps are natural targets for larger groups, which frequently accept to pay a generous premium for acquiring knowledge, market share or capacity.
Despite that, as can be seen on the table above, Small Cap indices don’t systematically outperform Large Cap benchmarks on all time frames in all regions. We see that US Large Caps or Emerging Market Large Caps sometimes do better, but the differences between both is usually tiny. To wit, the SP 500 only lags the Russell 2000 by 50 basis points CAGR on a 10 year time frame.
But two regions clearly differ: Europe and Japan, where for all periods Large Caps lag Small Caps by a wide margin: the difference reaches almost 500 bps annually on a 10 year period (265 bps for Japan)! Such extremes call for a thorough explanation; when digging a little bit deeper into the indices, the underperformance of European (and to a lesser extent Japanese) Large Caps essentially derives from the index constituents. When it comes to Europe, Financial stocks make up more than 20% of the Large Caps benchmark, Telecoms and Utilities more than 6.5% combined and Information Technology only 5%, a very significant difference compared with Small Caps. Due to the dismal performance from Banks, Telecoms and Utilities during the last decade, we have the explanation. In Japan, the performance spread between Large Caps and Small Caps stems more from the heavy representation of car manufacturers (also poor performers these last years) in the main benchmark. And in the US the heavy weightings of Technology behemoths in the S&P explains the narrowness between Large and Small Caps’ performances.
Should we expect European Large Caps indices to catch up with Small Caps? We frankly doubt it as national champions in Banks and Utilities will remain highly represented and due to their utmost importance for Governments, there is a clear trend for these businesses to face tougher and tougher regulations, which does not bode well for future equity performances. They can be exciting short term trading ideas but can hardly be considered as attractive long term investments.
Consequently, we are still extremely favorable to the Small Caps space in Europe, especially that there are numerous talented boutique managers doing a brilliant job on the asset class, who generate high level alpha over the years. So by cherry picking them we get the best of both worlds: a very good asset class managed by very good investment professionals…. Beautiful, indeed!