August General Market Comments

August General Market Comments

“Hard to Handle”, Otis Redding, 1968, The Black Crowes, 1990.

Markets are good overall in 2023, but, to paraphrase Otis Redding in his 1968 song (and the Black Crowes in a very good reprise in 1990), they are definitely “hard to handle”. Why is it so? Well, first of all the economy, and especially in the US, has given us its dose of surprises: consensus pointed to a serious slowdown, possibly a recession, following the aggressive rates increases from Central Banks, but this has not materialized yet, and should probably not before at least Q2 2024. Then, the famous China reopening trade (remember, this was THE big thing in November 2022) has turned out to be a damp squib with the Chinese equity market and the renminbi lagging big time (the property market being one of the possible explanations). Then, the consensual view of a fading dollar in 2023 has proven wrong: not only does the broad dollar index (DXY) hold well, more or less flat this year, but two important currencies have slumped versus the greenback, namely the Japanese Yen and the Chinese renminbi (respectively down 10.97% and 5.22%). Finally, style wise, the overall increase in long term bond yields (+60 bps for the US 10 year, +18 bps for the German Bund) should have prevented Growth from performing well; thanks to the hype around Artificial Intelligence, Growth has humiliated Value so far this year (+27.38% for the MSCI World Growth versus a lacklustre +3.07% for its Value counterpart). Yes, hard to handle, indeed.

All equity indices were down in August 2023, barring the Japanese Topix (up 0.4%, but with a weak JPY, down 2.38% versus the dollar): -1.77% for the S&P500, -1.62% for the Nasdaq, -2.79% for the Stoxx 600 and a disastrous -6.36% for the MSCI Emerging Markets. On the fixed income side, Credit was flat, the US 10 year yield added 15bps, while the German 10 year Bund yield receded by 3 bps; this divergence might explain, at least partly, the weak euro (-1.53% versus the USD). Oil rose 2.24% for the WTI, while Gold abandoned 1.27%, here again a strong dollar providing a possible explanation.

That’s it for this month’s Market Comments, stay tuned, markets never skip a beat.


Past performance is not indicative of future results. The views, strategies and financial instruments described in this document may not be suitable for all investors. Opinions expressed are current opinions as of date(s) appearing in this material only. References to market or composite indices, benchmarks or other measures of relative market performance over a specified period of time are provided for your information only. NS PARTNERS SA provides no warranty and makes no representation of any kind whatsoever regarding the accuracy and completeness of any data, including financial market data or other financial instruments referred to in this general comment. This document does not constitute an offer or solicitation to any person in any jurisdiction in which such offer or solicitation is not authorized or to any person to whom it would be unlawful to make such offer or solicitation. Any reference in this document to specific securities and issuers are for illustrative purposes only, and should not be interpreted as recommendations to purchase or sell those securities. References in this document to investment funds that have not been registered with the FINMA cannot be distributed in or from Switzerland except to certain categories of eligible investors. Some of the entities of the NS Partners Group or its clients may hold a position in the financial instruments of any issuer discussed herein, or act as advisor to any such issuer. Additional information is available on request. © NS Partners Group
July General Market Comments

July General Market Comments

«The Magnificent Seven» – The Clash, 1980

“Gimme Honda, gimme Sony, so cheap and, real phony” goes Joe Strummer in this legendary song from the Clash. We could transpose this into “Gimme Tesla, gimme Meta” today, as those two stocks stand among the magnificent seven performers of 2023 so far (with Alphabet, Microsoft, Amazon, Apple and Nvidia); the difference is that they don’t seem phony, and, for most of them, they’re far from being “so cheap”. In fact, these seven companies contributed to more than 55% of the performance of the S&P500 this year, which means that we could easily talk about a S&P 7 versus a S&P 493.

July 2023 has been a good month, again, for all risk assets: the MSCI World added 3.3%, the S&P500 3.1%, the Stoxx 600 2% (but the euro rose 0.9% versus the greenback), the Topix 1.5% (the Yen being up 1.5% versus the dollar after the change of tone from the BoJ regarding its yield curve control), and finally Emerging Markets caught up with a 5.8% return.

Styles reverted a smidgen on a global basis, with the MSCI World Value advancing more than the MSCI World Growth (3.7% versus 2.9%). One can still feel flummoxed when looking at the performance gap between both indices this year, Growth being up 30.2% versus a meagre 6.3% for Value. All hopes of a return to the mean between styles have been dwarfed in 2023.

July has also been very profitable for Credit, again, as the Itraxx Crossover added 1.5%, for Commodities (Gold up 2.4%, Oil 15.8%), which finally leaves Government Bonds as the only outliers with rising yields overall: +12 bps for the US 10 year, +10 for Bunds and +21 for JGBs.

That’s it for this month’s Market Comments, stay tuned, markets never skip a beat.


Past performance is not indicative of future results. The views, strategies and financial instruments described in this document may not be suitable for all investors. Opinions expressed are current opinions as of date(s) appearing in this material only. References to market or composite indices, benchmarks or other measures of relative market performance over a specified period of time are provided for your information only. NS PARTNERS SA provides no warranty and makes no representation of any kind whatsoever regarding the accuracy and completeness of any data, including financial market data or other financial instruments referred to in this general comment. This document does not constitute an offer or solicitation to any person in any jurisdiction in which such offer or solicitation is not authorized or to any person to whom it would be unlawful to make such offer or solicitation. Any reference in this document to specific securities and issuers are for illustrative purposes only, and should not be interpreted as recommendations to purchase or sell those securities. References in this document to investment funds that have not been registered with the FINMA cannot be distributed in or from Switzerland except to certain categories of eligible investors. Some of the entities of the NS Partners Group or its clients may hold a position in the financial instruments of any issuer discussed herein, or act as advisor to any such issuer. Additional information is available on request. © NS Partners Group

Chart of the Month – The mystery of stock prices falling despite earnings increasing

The mystery of stock prices falling despite earnings increasing

Source: Notz Stucki

“Millions saw the apple fall, but Newton asked why.”
Bernard Baruch

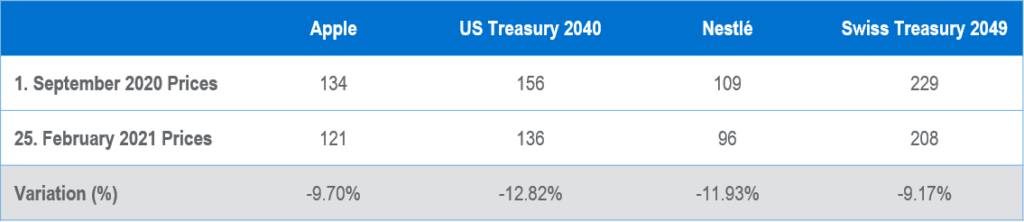
Apple and Nestlé, among many popular large-cap stocks did not perform well since September 2020, despite a rising broad market and favorable earnings releases. Between September 2020 and February 2021, Apple fell close to 10% and Nestlé 12%. Although the most important thing for a stock to perform well over the long term is by far its earnings growth, sometimes, shorter term, this isn’t sufficient to compensate for the other most important factor when it comes to asset prices in general: interest rates. This love and hate relationship between equities and interest rates should, in theory, be very simple to assess: falling interest rates are good for equities as it magnifies future flows, while rising interest rates do the opposite. But this has not been the case all the time; popular “risk-parity” strategies were playing against the maths logic as they were long fixed-income and equities in order to have a protection on possible equity downside thanks to supposedly good returns from bonds when it happens. But this is not what the maths tell you: if the discounting factor (i.e. interest rates) moves higher, then the price of your asset, all else things equal, falls.

And this is precisely what happened during the last 6 months (for some listed companies), as the discounting factor rose quite sharply (US 10 year yield went from 0.7% to 1.47%, 20 year yield from 1.24% to 2.15%). Guess what, maths worked perfectly well this time as long duration equities fell, almost in line with the fall in bond prices like the table above highlights. Apple’s Price Earnings Ratio went from 34 to 27 times 2021 estimated earnings, for Nestlé it moved from 26 times to less than 23. Here’s the proof that although higher yields do not really affect the business of these companies, it definitely has an influence on their valuations. But there are equity sectors which show an inverted correlation compared to what the maths say. First and foremost, financials, the most hatred sector of the last decade. Rising interest rates is good for banks and insurance companies. More broadly, cyclical sectors tend to be shorter duration assets than growth and defensive sectors and logically outperform when yields move to the upside. The very good performance from cyclical sectors since interest rates started to move up was the reason why indices were able to grind higher. This is why a balanced approach in terms of sectors is important. We don’t know if yields will keep on rising, stall or fall; but we do know that building a portfolio of good companies, whatever their sectors, with a nice equilibrium between Value/Growth and Cyclicals/Defensives is the surest way to deliver appreciable returns over the long term.


Past performance is not indicative of future results. The views, strategies and financial instruments described in this document may not be suitable for all investors. Opinions expressed are current opinions as of date(s) appearing in this material only.

References to market or composite indices, benchmarks or other measures of relative market performance over a specified period of time are provided for your information only. Notz, Stucki provides no warranty and makes no representation of any kind whatsoever regarding the accuracy and completeness of any data, including financial market data, quotes, research notes or other financial instrument referred to in this document.

This document does not constitute an offer or solicitation to any person in any jurisdiction in which such offer or solicitation is not authorized or to any person to whom it would be unlawful to make such offer or solicitation. Any reference in this document to specific securities and issuers are for illustrative purposes only, and should not be interpreted as recommendations to purchase or sell those securities. References in this document to investment funds that have not been registered with the FINMA cannot be distributed in or from Switzerland except to certain categories of eligible investors. Some of the entities of the Notz Stucki Group or its clients may hold a position in the financial instruments of any issuer discussed herein, or act as advisor to any such issuer.

 Additional information is available on request.

© Notz Stucki Group