Quarterly Investment Review – Q2 2025

We’re running roughly a 7% fiscal gap and probably a 3% gap is what’s sustainable. The further you drift from that, the closer you get to the point where it becomes uncontrollable. It’s a job I don’t want, but it’s a job that needs to be done.

Warren Buffett on DOGE & the US deficit in his final Berkshire meeting

The US no longer represents a rock such as anchored the West for so many decades, but more like sand, shifting underfoot.

Max Hastings


Quarterly Investment Review – Q2 2025

The second quarter of 2025 started in dramatic fashion with the announcement by President Trump of his tariff proposals, described by him as Liberation Day. This precipitated the largest three-day decline in the S&P since the 1987 crash, leading to the temporary easing and suspension of the tariffs till July 8th while further negotiations take place. The quarter ended equally dramatically with the US engaging in the first official military action against Iran since 1979, when the Shah was deposed. The scale of the tariffs was shocking with countries facing double, treble or more of what they had expected, and the announcement was delivered with unusually undiplomatic aggression. At the end of May Elon Musk, who had led the cost cutting DOGE initiative, departed having fallen far short of the original targets set in the post-election euphoria. However, despite all these upheavals, by the end of the quarter most stock markets had advanced, and bond yields were barely changed. The only significant impact was on the dollar which fell by 10.7%, recording the worst first six months start to the year since 1973. Gold rose by 6%, and bitcoin by 30%. So, despite the chaotic political and military news flow financial markets enjoyed a good quarter.

The final level of US tariffs is still unknown, but on current indications the likelihood is that they will settle around 14-15%, a far higher amount than has prevailed for decades, but lower than threatened in early April. At one point Trump imposed a 145% rate on China. For comparison the effective tariff rate was 2.4% last year. It hasn’t been clear whether the primary purpose of these tariffs is to raise revenue or encourage industries to reshore, but their inflationary potential and the uncertainty that they cause for many industries has caused considerable alarm for businesses. Politically though they have worked for Trump. They exhibit a clear preference for labour over capital, making them popular in the swing states which secured his election victory last November, and given the electoral importance of these states these policies are likely to be durable. Yet with China Trump appears to have overplayed his hand. China depends on little from the US beyond semi-conductors, and even here the technological gap is closing, whereas the US imports hundreds of products from China, many of them of critical importance, hence the enormous trade deficit. Even the US defence industry depends on Chinese-processed rare earths to keep going. With so many American businesses dependent on Chinese supply chains the US was forced to back down from its initial position. By contrast, China is well prepared for this trade war having been adjusting to American aggression on trade policy since 2017. Given how intertwined the two economies have become after thirty years of integration, a face-saving resolution is in both sides interest.

Click HERE to download the full document.


Past performance is not indicative of future results. The views, strategies and financial instruments described in this document may not be suitable for all investors. Opinions expressed are current opinions as of date(s) appearing in this material only. References to market or composite indices, benchmarks or other measures of relative market performance over a specified period of time are provided for your information only. NS Partners provides no warranty and makes no representation of any kind whatsoever regarding the accuracy and completeness of any data, including financial market data, quotes, research notes or other financial instrument referred to in this document. This document does not constitute an offer or solicitation to any person in any jurisdiction in which such offer or solicitation is not authorized or to any person to whom it would be unlawful to make such offer or solicitation. Any reference in this document to specific securities and issuers are for illustrative purposes only, and should not be interpreted as recommendations to purchase or sell those securities. References in this document to investment funds that have not been registered with the FINMA cannot be distributed in or from Switzerland except to certain categories of eligible investors. Some of the entities of the NS Partners Group or its clients may hold a position in the financial instruments of any issuer discussed herein, or act as advisor to any such issuer. Additional information is available on request. © NS Partners Group

Investment Outlook Q4 2017

Notz Stucki has just released its investment outlook for the last quarter of 2017.

Contrary to predictions at the start of the year, when it was expected that they would have to contend with rising interest rates, markets have been strong this year. Moreover one of the main hopes on President Trump’s election was that he would cut taxes and introduce a one billion dollar infrastructure plan. Not only has a clear tax policy not been set out by his Administration, but little else of any significance has been achieved so far, and the White House has suffered a dismaying series of shambolic incidents.

Evidence mounts that Mr Trump lacks the skills to run the executive arm of government, which is all the more disturbing given the bellicose situation in North Korea. However markets have risen against a background of steady economic growth and continued low interest rates. What the rise in the indices masks though is what a narrow market it has been. It has been a market driven by passive flows, with more and more money being run by ETFs. Any change to either the low interest rate environment or the cult of ETFs would have profound implications for investors.
Further evidence of the desperate hunt for yield was revealed in the last quarter.

Please click here to download the entire document.


Chart of the Month – CAPE–ability in question

CAPE–ability in question

« In theory there’s not much difference between practice and theory – but in practice, there is. » Yogi Berra.

Source: Bloomberg, Notz Stucki

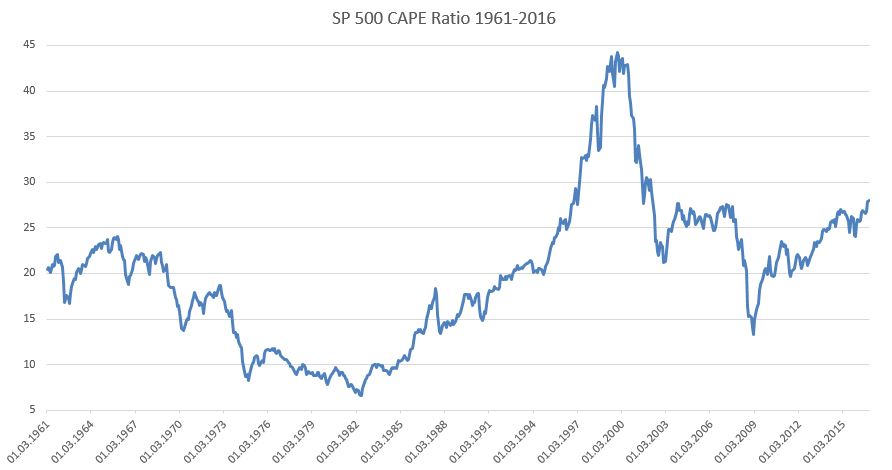
More and more warnings are being sent about the unsustainability of the current CAPE ratio for the SP500 and that a correction should occur, based on the very high level of the famous CAPE – the Cyclically Adjusted Price Earnings ratio.

This valuation measure of the equity market, brought by John Campbell and Robert Shiller in 1988, consists in taking a long term (typically 10 years) average of real earnings to calculate the Price Earnings ratio of a given equity index in order to smooth out short term profits’ volatility.

The economists did not set an absolute level of cheapness or expensiveness for their ratio, but the frequently mentioned levels are 20 (expensive) and 12 (cheap). Based on these numbers, investors should be wary of buying stocks when the CAPE stands above 20 (currently it is close to 28), and should on the contrary increase their exposure when the CAPE hovers below 12.

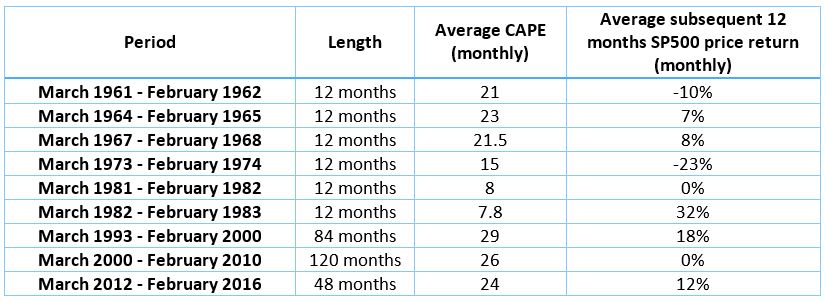
Our friend Jeffrey Saut, chief strategist at Raymond James Associates, has repeatedly questioned the accuracy of this measure during the last few years, so we’ve decided to crunch the numbers and simply look at some historical data to assess the relevance of the current warnings about the CAPE. The table here below recapitulates some periods with their associated CAPE and the monthly average of the subsequent 12 month price return on the SP500.

CAPE ratio

Based on these numbers, the conclusion is pretty straightforward: the predicting power of the CAPE for future returns is extremely poor if you set the 20 and 12 levels for dearness or attractiveness. Maybe the most striking example is between 1993-2000 when the average CAPE was 29, a record, but the average SP500 return of any given 12 month period during this time frame was a whopping 18%!

Even though CAPE is high today we think it has to be mitigated by a few factors:

  1. Interest rates ar still at historical lows, propping up valuations.
  2. Today’s CAPE includes the terrible 2008-2009 period when earnings were decimated, which should correct after 2019 CAPE calculations.
  3. The SP500 today is less cyclical than it used to be. There’s dominant group of sector like non -cyclical Information Technology, Healthcare, Consumer Staples which were not so highly represented in the past, when Industrials, Energy and Consumer Discretionary had much higher weightings.
  4. History seems to tell us that, as shown in the table, there’s no golden rule for assessing an alarming level for the CAPE.

The well-known CAPE theory would incite us to step away from US equities today, but we beg to differ.

Practice, as Yogi Berra said, does not necessarily go in sync with theory!


Notz Stucki January 2017 investment conference in Geneva : notes

On the occasion of its semi-annual Investment Conference in Geneva held on January 10th, 2017, Notz Stucki welcomed the following guest speakers:

Jeffrey Saut, Chief Investment Strategist & Managing Director, Equity Research, Raymond James
Louis-Vincent Gave, Chief Executive Officer, Gavekal
Christian Kopf, Director of Economic Research and Investment Strategy, Spinnaker Capital Group
Juerg Nagel, Partner, Member of the Management Board, Head of Portfolio Management & Marketing, MIV Asset Management

DPC and audience
Damiano Paterno Castello introducing the conference and our guest speakers

Here are the notes on the conference.

2016 was a year of political surprises, and in markets a year in which almost all managers struggled to keep up with the indices. The political upsets have been well covered. The poor relative performance of active managers has been widely discussed too. 2016 was a tough year for them as illustrated by considering that the Dow moved 31,000 points as calculated by the daily moves, yet ended the year almost flat. The speakers all pointed to signs of a better environment for active managers, and a few other reasons why the last few years have been so difficult. First the S&P has been remarkably strong, outperforming almost everything. For example in 2015 only US Real Estate and International Small Caps did better. More interestingly if the cash holdings in mutual funds and implementation costs are stripped out then 50% of active managers beat their relevant ETFs. Indices have been driven by a fairly narrow group of stocks. These dominate the ETFs. As these stocks become overvalued it makes sense to have active rather than passive managers. Rising interest rates will also favour active managers as company fundamentals will count for more. Likewise the withdrawal of QE will help as QE has gushed money into relatively few stocks which have developed a momentum trade of their own. As QE ends stocks will have to rely more on their earnings to rise. The conference was presented with two different views of the US. Raymond James presented an extremely bullish view, and then Gavekal gave a much more cautious view, though they remain positive on markets elsewhere.

Jeffrey Saut, Chief Investment Strategist & Managing Director, Equity Research, Raymond James
Jeffrey Saut, Chief Investment Strategist & Managing Director, Equity Research, Raymond James @Notz Stucki Investment Conference

Raymond James’s view is that the market will continue to grind higher, albeit with periodic setbacks which are part and parcel of all bull markets. This is the most hated bull market in history and consequently most people are not in it. Yet bull markets usually endure for fourteen years suggesting that we are barely half way through this one. Encouragingly in July 2016 the market broke out to the upside after an eighteen month consolidation. Following the US elections and the Republican sweep of the Presidency and Congress there will be much more co-operation in Washington. This will enable the smoother passage of the proposed tax reform, and fiscal package. Alongside this the Fed is likely to raise interest rates at a glacial pace. As profits recover the market will transition from one driven by interest rates to one driven by earnings. Low inflation, rising earnings, and slow rises in interest rates will create a strong environment for a rising market. Employment is strong which will keep consumption strong and the US is underpinned by soaring levels of creativity and technological improvements. US energy is booming, the banks are in good shape, manufacturing is improving, and corporate balance sheets are healthy. In 2017 S&P earnings are forecast to be $131 which puts the market on a multiple of 17 times. However every 1% of tax cut can increase those earnings by $1.31 so if Trump achieves the 20% tax cut he’s proposed the earnings can increase by up to $26. The one area to avoid are the bond proxies as the bond bull market is probably over. Themes like waste collection, cyber security, e-commerce, defence and disruptive technology all have powerful tailwinds. With no sign of investor enthusiasm for the market and plenty of supports the market should grind higher.

Louis-Vincent Gave, CEO, Gavekal @Notz Stucki Investment Conference

Gavekal is not worried about two of the issues that are on many commentators worry list for 2017, namely Europe and China. Europe’s elections this year will be less dramatic than last year’s. Le Pen won’t win in France, and Merkel will win in Germany. With oil prices low and the euro weak the European economy is supported. Indeed it may be a coiled spring as having experienced little investment for ten years, if things do improve then the rebound could be dramatic. Europe can therefore be a source of upside surprise. China is in a year of political transition and will be focused on things being stable at all costs.

Gavekal’s concerns centre more on the US. These concerns are largely Trump related. The largest uncertainty is the question as to what extent his campaign rhetoric on reducing globalisation to protect American jobs will be put into practice. Potentially this is extremely harmful for a whole range of US companies and those in the rest of the world. If Trump really attacks globalisation it will be hugely disruptive. The risk of this seems uncomfortably high. It is hard to assess but given the high levels of US equities they seem vulnerable to having priced in the good news (not yet enacted), and to be ignoring any negatives which could be substantial.

Another concern is how the fiscal deficit will be financed. Trump starts his Presidency with US Government debt at $20 trillion. This debt has ballooned in the last few years and most of it was bought by the Fed, but they have stopped buying and are trying to unwind their position. US consumers or companies could buy it but the Trump plan envisages them to continue spending and to start to invest. Foreigners could but they have been selling US bonds recently. With the Fed shrinking its balance sheet and foreign Central Banks withdrawing money, liquidity is tightening. This could lead to problems but markets have been behaving as though we are entering a reflation. This is why Trump’s attitude is on globalisation and trade is so crucial. If the US turns protectionist then from the current exuberant position the markets’ reaction could be severe. If not, and Trump retreats from his rhetorical position and basically accepts the evolving trading relations of past decades, then the world may experience a similar cycle seen in the last forty years whereby a strong US lifts everywhere else, but particularly those export countries that sell there like North Asia. The US fiscal deficit will then expand to the benefit of the rest of the world. The binary nature of this situation shows the difficulty of this market. It is impossible to invest for both outcomes.

Christian Kopf, Director of Economic Research and Investment Strategy, Spinnaker Capital Group about "A Rising Tide – Spinnaker Capital’s Outlook for Emerging Markets" @Notz Stucki Investment Conference
Christian Kopf, Director of Economic Research and Investment Strategy, Spinnaker Capital Group about
“A Rising Tide – Spinnaker Capital’s Outlook for Emerging Markets” @Notz Stucki Investment Conference

Markets have started strong in the first week of 2017, continuing the rally in the last two months of 2016. Mr Trump will be inaugurated as President in ten days and then we will start to see what his policies really are. Given the strength of the recent rally a consolidation is likely anyway. Whether the optimism of the markets is justified or whether the markets have got ahead of themselves will become evident as the new administration reveals itself during the course of the year. However the dynamism of US business should never be under-estimated and that will continue to present opportunities regardless of the politics. There are lower valuations in the rest of the world and following several gloomy years if Europe and Asia can achieve a more confident attitude then these markets may surprise. The US market may be the most hated bull market but virtually no-one owns Europe with confidence so any improvement in sentiment could lead to a better market.

Juerg Nagel, , Partner, Member of the Management Board, Head of Portfolio Management & Marketing, MIV Asset Management about "Innovation in Medtech" @Notz Stucki Investment Conference
Juerg Nagel, , Partner, Member of the Management Board, Head of Portfolio Management & Marketing, MIV Asset Management, about “Innovation in Medtech” @Notz Stucki Investment Conference

Written by James Macpherson


Happy 1st Anniversary DGC Notz Stucki Raymond James Strong Buy Selection

DGC NOTZ STUCKI RAYMOND JAMES STRONG BUY SELECTION’S ASSETS CLIMB ABOVE € 50 MILLION FOR ITS FIRST ANNIVERSARY

The fund exhibits a 19.14% performance since the beginning of the year

What are the origins of this blockbuster?

After a setup of several months, a partnership was created between Notz Stucki Group, one of the largest independent asset management companies in Switzerland, incorporated in 1964, and Raymond James & Associates, a US firm founded in 1962 which proposes various financial services like brokerage, research and advice. This partnership gave birth to a US Equities fund. Raymond James & Associates, thanks to the depth and quality of its research, brings the list of its « Strong Buy » rated stocks, and Notz Stucki takes care of portfolio construction and supervisory of each position (weightings, rebalancing,..).
The fund is a UCIT V daily product and is under the umbrella of the DGC Sicav (« Diversified Growth Company ») which is run by Notz Stucki’s Luxemburg team. The fund’s performance this year puts it in the top 8% of its Bloomberg peer group.

How is the fund invested? 

The fund replicates the entire Raymond James US Strong Buy list. 3 different weightings are applied, depending on market caps. This fund is fully invested with cash levels typically below 1.5%. Very much attention is paid to transaction costs and for that purpose, rebalancing is activated only twice a month. The fund is extremely reactive: stocks upgraded to « Strong Buy » are almost immediately included in the portfolio while those downgraded to any recommendation below “Strong Buy” are excluded from DGC Notz Stucki Raymond James Strong Buy Selection’s portfolio right away.

Chart of the Month: 1986 – 2016 « LIVE TO TELL » (MADONNA)

Chart of the Month

1986 – 2016. « LIVE TO TELL » (MADONNA)

In 1986 Madonna was singing a very nice song titled « Live to Tell » which rapidly became a hit.

Although the song was by no means a reference to financial markets, it’s easy to extrapolate with the title and imagine the great singer wondering what would be the best way to invest the revenues generated by the huge sales of her record over a 30 years horizon. Now that this 30 years’ time period comes to an end, she has lived to tell the right choice that was to be made in terms of investment in 1986.

Here below is a simple table of the annualized returns of the S&P 500 with dividends, a 30 year Treasury Strip, Money Market (less than 12 month T-bills) and Gold:

November 2016_PMO_Live to Tell

As a reminder, inflation (CPI USA) has run at a 2.62% annualized pace over this period, so one 2016 dollar is worth 2.2 times less than a 1986 dollar.

It appears clearly, with hindsight, that in terms of absolute performance nothing compares to equities, but the 8.92% annualized return on the US 30 year Treasury Strip is unbelievable (for a liquid Aaa fixed income instrument). Otherwise, for those who wanted to avoid risk, money market has done its job by providing investors with a decent return, well ahead of inflation. And finally, Gold has done barely better than money market (but with much higher volatility).

Are there lessons to be drawn from this quick summary? Yes, certainly: over an extended period of time, equities are unsurprisingly the best investment, especially in the US where there is extremely low influence of the State on the stock market (as opposed to Europe and Japan where some companies are deemed strategic and are under pressure from their respective Governments). In the considered period, there were not less than 6 episodes of severe drawdowns (1987, 1990, 1998, 2000-2002, 2007-2009, 2011) and despite that the overall performance of the stock market remains more than compelling.

Another lesson is that the incredible performance of the bond market can’t be repeated with current yields at 3.1% on 30 years Treasury Strips. We have enjoyed an unprecedented bull market on bonds, and even if it can eventually deliver decent returns, they will by no means get close to those of the last 30 years.

At last, history seems to favor short term US T-bills over Gold for safety. The volatility attached to Gold makes it difficult to call the shiny stuff a safe investment.

As a conclusion, looking at past returns does not make sense for fixed income or money market because future returns will very largely depend on interest rates at entry levels. What is really interesting is that US Equities have the good habit of returning close to 10% annualized over the long term, whatever the start date. And the odds are pretty favorable for this to last!

Chart of the month: US Equities, small is beautiful (sometimes)

US EQUITIES: “SMALL IS BEAUTIFUL” (SOMETIMES)

Source: Bloomberg, IBES, Notz Stucki


In 1973, the British economist E. F. Schumacher published the book “Small is beautiful”. Although he did not talk about mid-small caps, the sentence is widely used to champion small players in all kinds of businesses. French & Fama published in the 80s the famous study that showed that, historically, small-mid caps had outperformed the SP500, which is called the “small firm effect”.

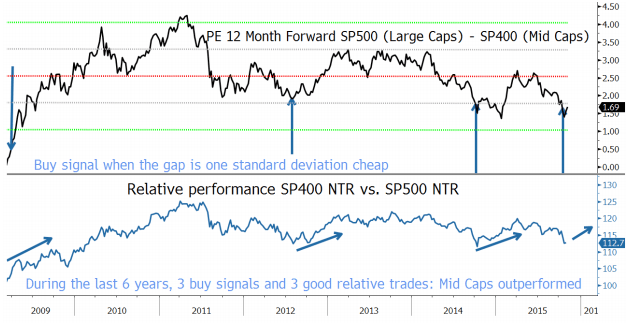
The lower panel shows the relative performance of the SP400 mid-caps versus the SP500 large-caps. During the last 6 years, mid-caps have outperformed large caps but not consistently, and so there are periods where large caps outperformed also. So what can we expect today and why?

The upper panel shows the relative PE 12month forward of mid-caps vs large-caps. The graph displays the ratio during the last 6 years with +/-1 and +/-2 standard deviations. Even though it is only a rough trading rule, we can see that when the relative valuation is one standard deviation cheap (blue arrows), historically mid-caps have outperformed large-caps (lower panel). From the valuation standpoint we are in a good situation to overweight the mid-caps in the US equity market.

From the fundamental point of view there are other good reasons to expect outperformance in the mid-cap universe also:

  1. Consensus earnings growth for SP400 mid-caps is 13.3% and 15.5% respectively for 2016 and 2017, whereas the consensus for the SP500 is 12.8% and 10.4% (IBES). Please, do not believe the absolute numbers, as analysts typically miss the growth by 6.5%, but the relative growth is what matters.
  2. The major victims of the strength of the USD are large caps which get a much higher proportion of their profits from overseas, so mid-caps will be more protected in this strong USD environment.

Both indexes have important differences in terms of sector composition as can be seen in the table below. This composition confirms that mid-caps are more exposed to the domestic market.

Total 100% 100%
Sector Exposure 30-nov.2015 SP 500 SP 400
Information Technology 21% 16%
Financials 17% 27%
Health Care 14% 9%
Consumer Discretionary 13% 13%
Industrials 10% 15%
Consumer Staples 10% 4%
Energy 7% 4%
Materials 3% 7%
Utilities 3% 5%
Telecom. Services 2% 0%

Source: Vanguard

Conclusion

In a low return environment, it is important to be able to profit from relative trading opportunities. With valuations relatively more attractive and better fundamentals, US mid-caps might be a better place than large caps.