Chart of the Month – Time to invest in midcaps in the us equity market

Chart of the Month – Time to invest in midcaps in the us equity market
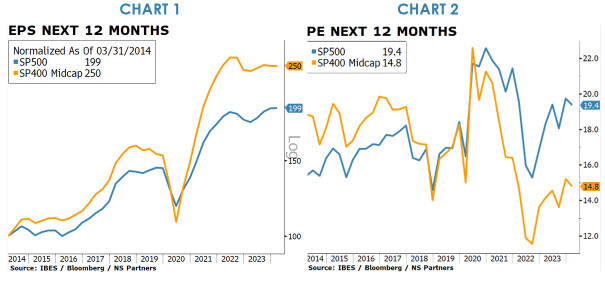
 

The investment landscape in the United States is often dominated by the allure of large-cap stocks, as evidenced by the S&P 500’s remarkable 26.3% rise in 2023. However, a closer examination of the market reveals an intriguing opportunity in mid-cap stocks. Despite the S&P 400 (Mid Caps) experiencing a lower rise of 16.4% in the same year, there’s a compelling case for why now might be the ideal time to partially pivot towards midcaps.

Over the last decade, the cumulative performance of the S&P 500, inclusive of dividends, stands at 212%, surpassing the S&P 400’s 143%. This disparity, however, opens a window into an underexplored investment avenue. According to Ibbotson data, smaller companies tend to outperform larger ones over the long term, primarily due to their faster profit growth. This trend is highlighted by Chart 1, which shows a 150% increase in Next 12 Month (NTM) profits for the S&P 400 over the last decade, compared to a 99% increase for the S&P 500.

A further analysis of market valuations and expectations reveals a striking disparity in Chart 2. The S&P 400 is currently trading at a Price-to-Earnings (PE) ratio of 14.8x NTM, a significant discount compared to the S&P 500’s 19.4x. Moreover, while the S&P 500 is expected to see a profit growth of 9.3% from year 1 to year 3, the S&P 400 anticipates a slightly higher growth rate of 10%. Thus, the market presents an opportunity to invest in an asset class with similar growth prospects to the S&P 500 but at a 24% discount.

Several factors contribute to this valuation gap. Firstly, the S&P 500’s higher exposure to the Information Technology sector (28% vs. 10%), boosted by advancements in Artificial Intelligence, skews its valuation upwards. Secondly, there have been significant inflows into ETFs linked to the S&P 500, particularly in the last three years. Lastly, midcaps are generally perceived as riskier than large caps, with a beta of 1.10 over the past decade.


Conclusion

The market, in its complex dynamics, often aligns closely with underlying economic realities. The current undervaluation of the S&P 400, when juxtaposed against its large-cap counterparts, seems excessive. For investors looking to adopt a defensive strategy, reallocating some investments from large caps to midcaps could be a prudent move. This shift not only leverages the historical trend of smaller companies outperforming larger ones but also takes advantage of the current market anomalies in valuation.


Past performance is not indicative of future results. The views, strategies and financial instruments described in this document may not be suitable for all investors. Opinions expressed are current opinions as of date(s) appearing in this material only. References to market or composite indices, benchmarks or other measures of relative market performance over a specified period of time are provided for your information only. NS Partners provides no warranty and makes no representation of any kind whatsoever regarding the accuracy and completeness of any data, including financial market data, quotes, research notes or other financial instrument referred to in this document. This document does not constitute an offer or solicitation to any person in any jurisdiction in which such offer or solicitation is not authorized or to any person to whom it would be unlawful to make such offer or solicitation. Any reference in this document to specific securities and issuers are for illustrative purposes only, and should not be interpreted as recommendations to purchase or sell those securities. References in this document to investment funds that have not been registered with the FINMA cannot be distributed in or from Switzerland except to certain categories of eligible investors. Some of the entities of the NS Partners Group or its clients may hold a position in the financial instruments of any issuer discussed herein, or act as advisor to any such issuer.  Additional information is available on request.
© NS Partners Group

SP 10 or SP 500?

SP 10 or SP 500?

This year, 10 tech stocks accounted for 100% of the SP500’s performance. Should we be worried?

The US equity market is particularly polarised in the first half of 2023. In fact, the contribution of just 5 companies (Apple, Microsoft, Nvidia, Alphabet and Amazon) out of the 500 that make up the SP 500 accounts for 77% of the index’s performance. Add Meta, Tesla, Broadcom, AMD and Salesforce and you get 100% of the performance of the world’s largest index. This means that 490 stocks will have been ‘worthless’ so far this year.

What these ten companies have in common is obvious: they all belong, in one way or another, to the technology sector or, more broadly, to the themes of digitalisation and artificial intelligence. While digitisation has been a major performance driver for almost 10 years now, the artificial intelligence craze has given it a considerable boost, notably with the increasingly widespread use of the famous ChatGPT.

PROGRESS IS MORE WIDESPREAD IN EUROPE

By way of comparison, the 10 biggest contributors to the performance of the Stoxx 600 in Europe account for only around a third of the index’s advance at this stage, and belong to sectors as diverse as luxury goods, pharmaceuticals, commodities, technology and consumer staples. This seems much healthier, even if part of the explanation for this eclecticism in Europe is to be found in the absence of information technology mega-caps on the Old Continent.

So is this narrowness of the US market (and of the global indices, which are largely made up of the aforementioned US stars) a bad omen that we should be worried about? Yes and no.

THE MARKET CANNOT DEPEND ON A SINGLE SECTOR

Yes, because, to paraphrase a military adage, defeat is certain if the generals advance and the troops do not follow. There is a clear risk here that the enthusiasm surrounding these great leaders will run out of steam, or that their valuations will simply become too demanding, leaving the market short of leadership and at the mercy of erratic fluctuations linked to interest rates, the economic climate or commodity prices. A single sector or theme cannot be the sole sustainable source of performance in indices as broad as the SP 500 or the MSCI World.

A VERY DIFFERENT SITUATION FROM THE INTERNET BUBBLE

No, because stock market history shows us that this type of situation is nothing new: it has frequently happened in the past that a handful of stocks have taken the whole market with them, without the market subsequently collapsing. What’s more, the major leaders we’re talking about today are formidable profit and cash flow machines. The comparison with the dotcom bubble of 2000 is therefore inappropriate, since at that time the profitability of the best-performing companies was low, if not non-existent. Finally, the economic reality behind the themes of digitalisation and artificial intelligence is more than clear: the related investment cycles are gigantic and far from over.

In conclusion, we will need to keep a close eye on the behaviour of the ‘rest’ of the market over the coming weeks and months. If the underperformance of the laggards increases, we will have to be very careful, as the market would then find itself overly dependent, and therefore dangerous, on a small number of companies. If, on the other hand, participation in the performance of the indices becomes more widespread, then this would confirm the good health of the market and provide an excellent reason to be very optimistic about equity investment.


Past performance is not indicative of future results. The views, strategies and financial instruments described in this document may not be suitable for all investors. Opinions expressed are current opinions as of the date(s) appearing in this material only. References to market or composite indices, benchmarks or other measures of relative market performance over a specified period of time are provided for your information only. NS Partners provides no warranty and makes no representation of any kind whatsoever regarding the accuracy and completeness of any data, including financial market data, quotes, research notes or other financial instruments referred to in this document. This document does not constitute an offer or solicitation to any person in any jurisdiction in which such offer or solicitation is not authorized or to any person to whom it would be unlawful to make such offer or solicitation. Any reference in this document to specific securities and issuers are for illustrative purposes only, and should not be interpreted as recommendations to purchase or sell those securities. References in this document to investment funds that have not been registered with the Finma cannot be distributed in or from Switzerland except to certain categories of eligible investors. Some of the entities of the NS Partners group or its clients may hold a position in the financial instruments of any issuer discussed herein, or act as advisor to any such issuer. Additional information is available on request.

© NS Partners Group

Investment Outlook Q1 2019

Where are the gilets jaunes of the bond market?

As the various Central Banks peddle back on their quantitative tightening program the financing needs correspondingly grow.  Buyers will need to be found at a point when competition for debt is rising. Global debt has climbed by $100 trillion since the financial crisis and sits around $240 trillion. China has been a big buyer of US Treasury bonds in the last two decades but as its economy slows and reorients from an export model towards one more focused on domestic consumption it will want to keep its savings at home and will have less surplus funds to invest abroad. Likewise the energy-producing Middle East has a demographic boom, and with oil prices lower and an expanding social welfare budget it is having to come to the capital markets for financing, becoming a competitor for funds rather than provider of them.  Perhaps the greatest risk in debt markets lies in the corporate sector. US companies have been prolific issuers of new debt, much of it poor quality. The ‘investment grade’ market is far larger today than it was heading into the 2008 crisis. When a recession eventually arrives a lot of this debt will turn sour.

Investors face a problematic environment. Bonds are unattractive, and in some cases unsafe. This leaves equities as the best option, but the emphasis on careful stock picking has increased. Markets have had a strong quarter so a consolidation period should be expected.  There is attractive value in a number of areas but this will require patience to unlock. With the US market richly priced the longer term opportunity should be in Emerging Markets, but this is unlikely to be realised until the US China trade dispute has a resolution.

Click here to download the full document.