Chart of the Month – «If you ask me anything I don’t know, I’m not going to answer» Yogi Berra
Chart of the month «If you ask me anything I don’t know, I’m not going to answer» Yogi Berra
And yes, here we go again with one of Yogi Berra’s insightful quote, which, this time, applies for the fate of the economy. It’s anybody’s guess today to give an indication of where the global economy is headed for the next 12 to 24 months, which should not come as a surprise considering the multiple unknowns ahead of us.
First come, first serve, the Covid crisis seems far from abating and its consequences, although now roughly measurable for its first wave, are as opaque as the horizon on a foggy day on Golden Gate Bridge when it comes to its second wave. The outcome of the US elections will have an influence on the US and the global economy (tax increases, domestic stimulus); how will the European economy get out of the current dire straits in which it is stuck; what happens next with the immense amounts of liquidity and debt generated since the start of the crisis; what are the next steps in the China-US economic war; and the list goes on.
Equity markets seem so far to give hope a chance as they’ve recovered sharply from the March lows, but we know things can revert very fast and, amidst this stock prices recovery, there has been an extreme differentiation between sectors, which means that the global picture isn’t that clear for investors.
There’s a very silent economist, who very seldom appears, and whose message is almost always accurate: that’s the US yield curve, and in particular the 3 month-10 year steepness.
Does the US yield curve know something we don’t, as it did many times in the past?
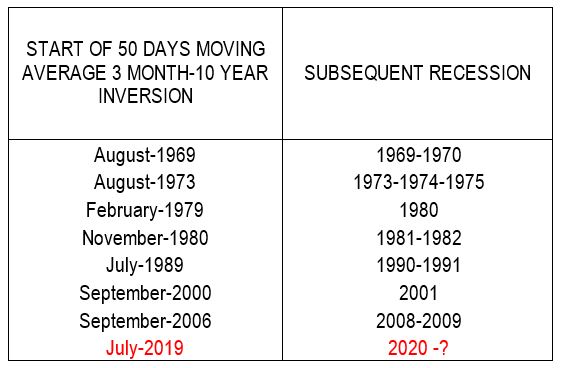
There have been 8 recessions in the US since 1969, including the current one. These 8 recessions had been announced in advance as shown on the table above by an inversion of the 50 days moving average of the US 3month-10 years yield differential (i.e. 3 month rates exceeding 10 years rates).
Very few paid attention to 2019’s inversion which happened in a buoyant mood for equity markets and, frankly, no cloud sufficiently big to make anybody contrarian enough to predict a recession in 2020. And this recession happened, for exogeneous factors (COVID-19) which, mid-2019, was totally unpredictable!
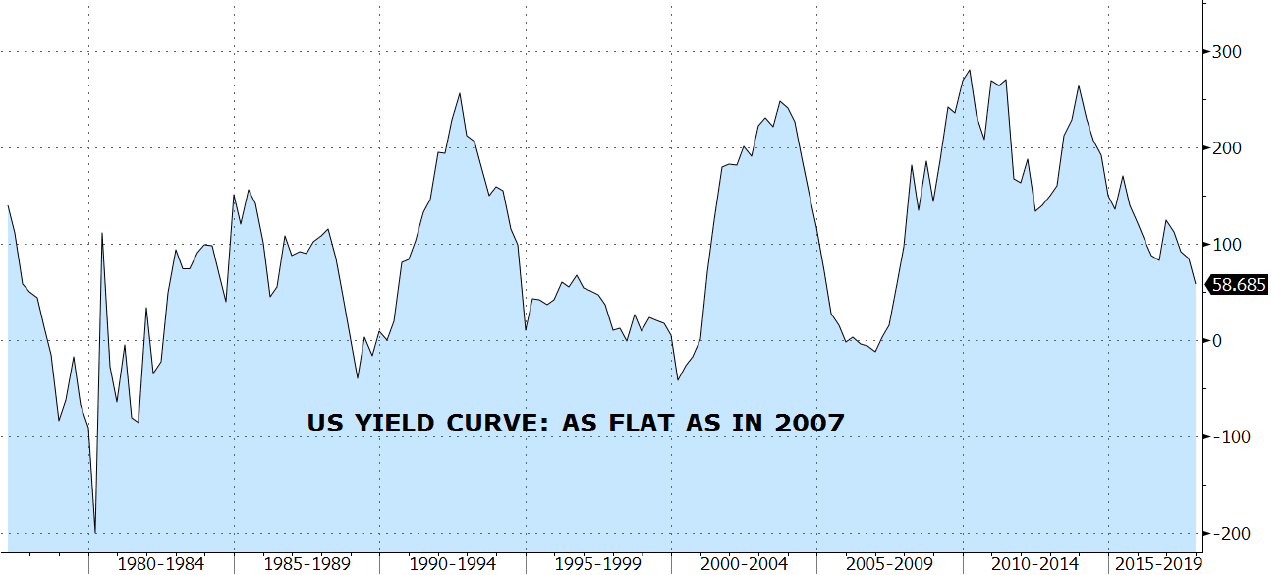
Now the good news, if we believe in the predictive power of the yield curve: it reverted into positive steepness in December 2019, and is now at its steepest point since then with a 57 basis points difference.
So if you’re questioned about something you don’t know, say the economy (nobody can predict the economy), you’re not going to answer; but the yield curve will. And today it’s a positive message.
Past performance is not indicative of future results. The views, strategies and financial instruments described in this document may not be suitable for all investors. Opinions expressed are current opinions as of date(s) appearing in this material only.
References to market or composite indices, benchmarks or other measures of relative market performance over a specified period of time are provided for your information only. Notz, Stucki provides no warranty and makes no representation of any kind whatsoever regarding the accuracy and completeness of any data, including financial market data, quotes, research notes or other financial instrument referred to in this document.
This document does not constitute an offer or solicitation to any person in any jurisdiction in which such offer or solicitation is not authorized or to any person to whom it would be unlawful to make such offer or solicitation. Any reference in this document to specific securities and issuers are for illustrative purposes only, and should not be interpreted as recommendations to purchase or sell those securities. References in this document to investment funds that have not been registered with the FINMA cannot be distributed in or from Switzerland except to certain categories of eligible investors. Some of the entities of the Notz Stucki Group or its clients may hold a position in the financial instruments of any issuer discussed herein, or act as advisor to any such issuer.
Additional information is available on request.
© Notz Stucki Group