January general market comments

“Ballroom Blitz” – The Sweet, 1974

China’s announcement of its LLM tool DeepSeek has been felt like a massive blitz in the global AI ballroom in January 2025. Supposedly way cheaper and less resources consuming (semiconductors and power) than its US equivalents, the DeepSeek bombshell triggered a vast series of questioning about the – so far – winners in the AI space, from chips manufacturers to industrial companies offering data centers cooling and utilities, among others. This, added to the looming tariffs from the US administration towards many of its trading partners, has generated a lot of volatility in global markets, which have nevertheless shown surprising resilience in such a context. Earnings releases have probably helped equities in this environment: in most instances they were good, even if, in some cases, outlooks were less buoyant than expectations (but still showing solid growth in general). Perhaps the continued strength in Gold (+6.6% in USD) and Bitcoin (+9.0% in USD), unbeknownst almost all major currencies, should be an indication that there are some signs of nervousness among the investment community.

The MSCI World rose 3.5% in January, nicely helped, for once, by Europe (+6.3% for the Stoxx 600) which has outpaced the S&P 500 (+2.7%). Despite DeepSeek’s smash, the Chinese market was weak with a 3% fall for the CSI300, and more generally Value outperformed Growth (+4.4% versus +2.6%), the latter having painfully felt Nvidia’s 10.6% retreat. It is noticeable that among European markets, the defensive Swiss equity benchmark SMI was the star of the month with a 8.6% return, reversing part of 2024’s underperformance.On the fixed-income side, yields stayed mostly put, while Credit started the year with a nice show, as highlighted by the 1.25% increase for the Itraxx Crossover. Oil rose 1.1%, and the dollar lost some modest ground versus the Euro, the Yen and the Renminbi.

That’s it for this month’s Market Comments, stay tuned, markets never skip a beat.


Past performance is not indicative of future results. The views, strategies and financial instruments described in this document may not be suitable for all investors. Opinions expressed are current opinions as of date(s) appearing in this material only. References to market or composite indices, benchmarks or other measures of relative market performance over a specified period of time are provided for your information only. NS PARTNERS SA provides no warranty and makes no representation of any kind whatsoever regarding the accuracy and completeness of any data, including financial market data or other financial instruments referred to in this general comment. This document does not constitute an offer or solicitation to any person in any jurisdiction in which such offer or solicitation is not authorized or to any person to whom it would be unlawful to make such offer or solicitation. Any reference in this document to specific securities and issuers are for illustrative purposes only, and should not be interpreted as recommendations to purchase or sell those securities. References in this document to investment funds that have not been registered with the FINMA cannot be distributed in or from Switzerland except to certain categories of eligible investors. Some of the entities of the NS Partners Group or its clients may hold a position in the financial instruments of any issuer discussed herein, or act as advisor to any such issuer. Additional information is available on request. © NS Partners Group

December general market comments

Dance across the floor – Jimmy “Bo” Horne, 1978

When Jimmy “Bo” Horne wrote this song in 1978, the “floor” still prevailed on the New York Stock Exchange; this was the place where most of the equity transactions were done, with traders and brokers actively buying and selling stocks. A decisively good year for equities traditionally ended with a festive atmosphere on the pit. Electronic trading has gradually started to supplant physical trading in the 80s, and has now almost entirely replaced it. With 2024 marking a very rare back-to-back 20% + yearly return for the S&P500, we can imagine that traders and brokers would have danced across the floor on the 31st of December, especially that, despite Covid, interest rates, inflation and geopolitics, the index has delivered a whopping 186% price performance since 2014.

Things could even have been better if December 2024 had not been a poor month for equities in general; the US economy is still defying the Cassandras, marking a sharp contrast with most regions. Fed’s ample easing expectations are being rattled down, with higher yields and a much stronger USD as a consequence. To wit, the US 10 year yield rose by 40 bps (+28 bps for the Bund), and the broad dollar index soared 2.6% (underneath the surface, the Euro was down 2.16%, but the Yen tanked 5.07%). WTI caught up 5.47% and ends the year flattish, Gold receded a tad (-0.7%, but still +27.2% for the year) and credit was barely down in an overall pretty positive year (+7.2% for the Itraxx Crossover in 2024).

When it comes to equities, very often does December confirm, and sometimes amplify, the general trends observed during the previous 11 month of any given year. 2024 was no exception, as, even if the market struggled contrarily to the rest of the year, style and sectors stubbornly maintained their trajectory. The nascent reversal triggered by Mr Trump’s win (the “Trump trade”) entirely faded and market polarization came back in force. Growth smashed Value with the Nasdaq up 0.4% versus -2.5% for the S&P500, but more striking is the performance gap between the MSCI World Growth and the MSCI World Value: +0.4% for the former and -5.8% for the latter in December, and +25.1% versus +9% in 2024, an incredible 1610 bps difference! Needless to say that winning Growth stocks, and among them the Magnificent-7 (or possibly the “Heavyw-8” with the addition of Broadcom), are in the US, which explains the vast outperformance from US equities versus all other markets so far.

That’s it for this month’s Market Comments, stay tuned, markets never skip a beat.


Past performance is not indicative of future results. The views, strategies and financial instruments described in this document may not be suitable for all investors. Opinions expressed are current opinions as of date(s) appearing in this material only. References to market or composite indices, benchmarks or other measures of relative market performance over a specified period of time are provided for your information only. NS PARTNERS SA provides no warranty and makes no representation of any kind whatsoever regarding the accuracy and completeness of any data, including financial market data or other financial instruments referred to in this general comment. This document does not constitute an offer or solicitation to any person in any jurisdiction in which such offer or solicitation is not authorized or to any person to whom it would be unlawful to make such offer or solicitation. Any reference in this document to specific securities and issuers are for illustrative purposes only, and should not be interpreted as recommendations to purchase or sell those securities. References in this document to investment funds that have not been registered with the FINMA cannot be distributed in or from Switzerland except to certain categories of eligible investors. Some of the entities of the NS Partners Group or its clients may hold a position in the financial instruments of any issuer discussed herein, or act as advisor to any such issuer. Additional information is available on request. © NS Partners Group

Protected: NS Investment Conference, 21 June 2023

This content is password-protected. To view it, please enter the password below.

Protected: NS Investment Conference, 10 January 2023

This content is password-protected. To view it, please enter the password below.

Quarterly Investment Outlook

The performance and current level of the world bond markets are extraordinary.
President Emmanuel Macron

The French example illustrates the bizarreness of this situation. French government debt reached €2.3 trillion at the end of 2018 and is estimated to expand by a further €80 billion this year, largely as a result of President Macron’s concessions to the gilet jaunes protestors. This puts its debt to GDP ratio at close to 100%, not as large as Italy’s but France’s debt is growing more quickly. France has not run a budget surplus since 1974 (before the current President was born), state spending is the highest of any country in the developed world at 56% of GDP, and it will be hard to raise taxes further as they are already the highest in the developed world at 46% of GDP having just overtaken Denmark, and the gilet jaunes movement indicates that the limits have been reached. It will also be challenging to grow out of this problem as economic growth has been lacklustre for several years. Most concerning of all is that France owes its debt in a currency that it does not control and cannot print, and most of it is borrowed from outside France (unlike say Italy where most of the debt is held internally). France has an outstanding credit record, not having defaulted since 1812, but it stands out among the negative yielding sovereign issuers for the combination of the poor profile of its finances and its inability to print money independently. It is irrational that such an issuer is paid for the debt it issues. For context, in the depths of the Great Depression of the early 1930’s when industrial production fell by a quarter the US ten year bond bottomed at a yield of 2.31%. Japan and a number of European countries’ debt markets are suggesting depression conditions, even though their economies are still growing.

Click here to download the full document.

Notz Stucki Investment Meeting – Pierre Gave

Is the worst of the global slowdown behind us?

In 2018 there was no place to hide in financial markets, but in the first quarter of this year a much better environment took hold. The turnaround is surprising in some ways. The fundamentals of most economies have not changed much. Growth has been slowing everywhere, but this was not unexpected. Given the length of the expansion, now a record 37 quarters in the US, a slowdown was inevitable. But for financial markets liquidity was the critical factor. After 10 years of central banks adding liquidity to the system, this reversed last year led by the US and China. Markets foundered, but when the Fed made a complete reversal of policy in January, and China announced a new stimulus package, the market rallied hard. The market reaction suggests they have repriced growth, but that growth has not come through yet. If there is one message that investors should take away it is that when the world’s monetary base contracts trouble follows.

While liquidity conditions remain benign it will still require fundamentals to do well for asset prices to rise from here. The outlook for the US economy is still positive, but the growth is more moderate than before. Two areas look likely to do well are the consumer and housing. Mortgage activity and construction should pick up, as affordability is good. A further positive is inflation is not a problem. There is some wage inflation, but it is modest. Globalisation and automation/robotics remain powerful forces on labour’s ability to bargain. A boost to the stock market could come from the dollar falling. On a PPP basis the dollar is expensive, but it enjoys a yield premium and the relative strength of the US economy. The principal concern in the US is debt. The US government deficit is projected to reach $1.4 trillion this year. Corporate debt has ballooned and much of it has been deployed in financial engineering, not invested in productive assets. For example in Q4 2018 there was a record $225 billion of share buy backs. But total US leverage is not so bad because household leverage has declined.

Europe is much more vulnerable to world trade and global growth declining. If President Trump introduces tariffs on the auto sector this would be significant. For Germany in particular the auto sector is an important part of the economy. Car production already faces a weak environment as it is in the middle of a big technological shift, and sales  in China slow as capacity has been reached, and demand there now enters a replacement cycle phase. Europe’s domestic demand remains sluggish, and this is being worsened by the recent rise in oil prices. The ECB are at the limits of what they can do with monetary policy. In theory Europe should undertake a fiscal stimulus, but it is constrained by fiscal rules on this. Indeed the German Finance minister has just said that weak growth limits the ability to make fiscal packages. If Germany slips into recession then this thinking may start to change. To reinvigorate Europe probably requires massive fiscal stimulus by a tax cut and infrastructure packages. For now there is little appetite for this.

China has also slowed, but it should pick up in the second half. China’s slowdown is different from its previous ones which centred on its industrial economy. This time the slow down relates more to the consumer credit. The export numbers have also fallen, but this may be due to buyers building inventory ahead of US tariff imposition. Nonetheless China is ramping up stimulus and the results should be seen in the second half. It will mean that leverage will rise again in China, which may become a problem in the future, but is not a concern for now. A recovery in China will help the emerging markets where investors are massively underweight, but they are unlikely to rebalance until the dollar weakens.

There is a calmer mood in the market compared to the end of last year. It has been created by the Fed stepping back from raising rates, China’s stimulus, and a brighter outlook on the US-China trade talks. Against that must be weighed the fact that global growth is slowing, Europe is on the brink of recession and US government borrowing is far too high for this stage of the cycle. A big unknown swing factor is the oil price which has been rising recently. If this continues it could upset the better sentiment. But the combination of the world’s two major economies looking set for steady growth this year, and no sign of inflation, provides a good background for equities.

Please click here to download the investment policy notes.

Investment Outlook Q2 2017

Notz Stucki has just released its investment outlook for the second quarter of 2017.

The first quarter was considerably calmer than that of 2016. On the political front the Dutch election was won by the sitting Prime Minister, which marked a break of a string of losses by incumbents in recent major elections. With predictions for the French election pointing to M. Macron as the likely winner the rise of the extremist parties in Europe seems to have been halted for the time being. In the US President Trump took office.

trump speech

Trump’s election on the pledge that he would throttle the State (‘drain the swamp’) was an attractive pitch, and brought the voice of the middle states to the elitist coast. However by the end of the quarter the complexity of getting anything done in Washington was starting to restrain him, as his first major legislative test to overturn Obamacare failed. That said business confidence has perked up following Trump’s election, partly due to the hope of tax cuts, but also to a revival of energy in middle class entrepreneurs.


Please click here to download the entire document.

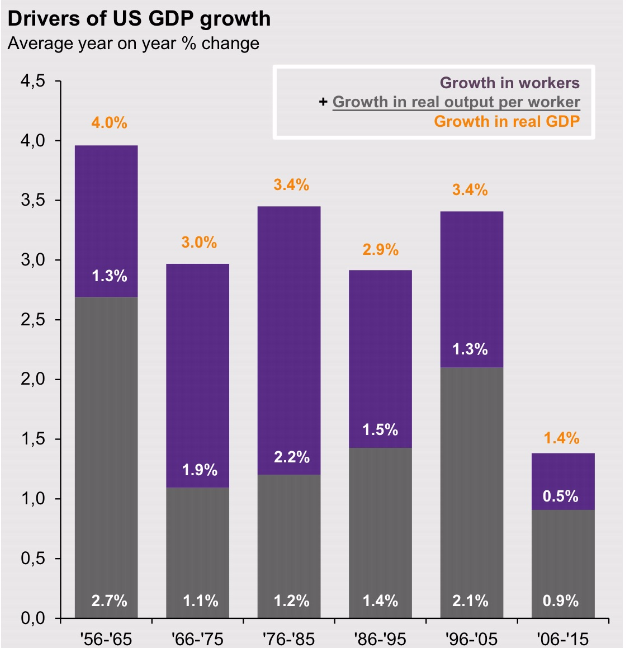
Chart of the Month – Drivers of US GDP growth: Can the US grow faster?

DRIVERS OF US GDP GROWTH: CAN THE US GROW FASTER?

Source: BEA, BLS, J.P. Morgan Asset Management. GDP drivers are calculated as the average annualised growth between 4Q of the first and last year. Future working age population is calculated as the total estimated number of Americans from the Census Bureau, controlled for military enrollment, growth in institutionalised population and demographic trends

Before the US election, the consensus view was that potential growth for the US economy was about 1.5% – 2.0%. After Trump won the elections, many market players are discounting higher growth rates due to the coming deregulation and fiscal stimuli. Whether this potential growth is 1.5% or 3.0% has very important implications in the capital markets, so it is worthy to review the main drivers of growth and what we can expect.

The chart shows the two sources of GDP growth, and unfortunately what we see is a deceleration in the growth rate during the last decade that might continue during the next decade also:

  1. Growth in workers.
    1. Natality rate has been decreasing over time, so the previous disappointing trend of lower birth rate is likely to continue.
    2. Immigration rate, if properly controlled, has been an important source of growth in countries like the US, Australia, UK or Switzerland to name a few successful ones. If UK or USA reduce the immigration rate, chances are that this source of growth decreases during the next decade. It would be especially bad for the US to restrict immigration for the high skillful people who would go to the USA to work for the Information Technology industry.
  2. Growth in real output per worker. First of all, it sounds counterintuitive that productivity has increased at a lower rate during the last “information age” decade. We are not going to talk about this as there are a lot of good academic papers that covers this issue without a definitive conclusion, but facts are facts, and productivity growth is running at the lowest Post-WW2 level.
    1. Capital investments: Good capital investments in infrastructure, IT, etc. increase real output per worker. The infrastructure investments that will be done by the Trump administration will certainly contribute to higher productivity in the USA.
    2. Regulations: Red tape and excessive bureaucracy are deterrents of GDP growth. The Trump administration will improve this.
    3. Human capital: This is one of the most neglected part of the sources of GDP growth even though is evident to most people (we all spent a lot of money on our children’s education). In the Trump’s agenda there is no indication that the US will be spending more money on human capital. A very interesting idea is to promote the vocational school system in place in countries like Germany, Austria or Switzerland where productivity is good and unemployment is low, even in the sectors exposed to globalization.

Free International Trade: It is difficult to introduce this element in the chart, but according to most academic studies since Ricardo, Free International Trade is mutually beneficial to everybody. That is why WTO has been so successful and that is why the European Union started with 6 countries and went to 28 (likely to go to 27 after Brexit).

The summary of these considerations can be:

  • GDP growth enhancers: Infrastructure investments and lower regulations.
  • GDP growth deterrents: Immigration policy and less international trade.
  • GDP growth neutral: Similar natality rate and no changes in the educational system.

Depending on the magnitude of those policies, we will see the impact on the coming GDP growth, and honestly we do not know at this stage, but is good to have a handy framework with the relevant variables.

Chart of the Month: US Healthcare sector, an appealing opportunity?

US Healthcare sector : an appealing opportunity?

Stock market trends over time
Source: Bloomberg

The US Healthcare sector is comprised of Pharmaceutical, Biotech, Medical Equipment and Hospital companies.

Due to Hilary Clinton’s Tweet in 3Q15 to restrict pricing policies, this sector has corrected with high volatility. Despite that, earnings continue to grow steadily: +12% annualized growth over the last 3 years and expected to grow on average +10% per year in 2017 and 2018.

This sector now trades at a Price/Earnings Ratio of 14.4 which is 13% cheaper that the S&P500 Index itself (16.5 times), and such with higher earnings growth!

Hilary Clinton is now likely to win the White House but the House is likely to remain on the Republican side. She therefore won’t be in a position to implement some of her feared changes.

If this is the case, less uncertainty will soon be reflected with higher share prices, as long as earnings don’t disappoint!

Large Biotech companies could be of particular interest.